Mercer Advisors Logo

What’s the Best Way to Invest Money? Stocks, Bonds, Mutual Funds

Donald Calcagni

MBA, MST, CFP®, AIF®, Chief Investment Officer

Summary

Stocks, Bonds, Mutual Funds: What’s the Best Way to Invest?

SUMMARY

Factor investing offers a smart, transparent, and rules-based alternative to both indexing and active management. Borrowing from indexing and active management, factor investing takes a structured, process-driven approach to investing—embracing broad diversification and the theory of market efficiency.

You’ve worked closely with a trusted advisor to build your financial plan and you’re clear on where you currently stand and where exactly it is you want to go. Your financial plan is the roadmap for how to get there. The final remaining piece of the puzzle, how best to invest your savings, is a critical one. Your portfolio is the engine that will drive your financial plan.

Get it wrong and you could find yourself wildly off course, perhaps with your destination permanently out of reach. Get it right, and you arrive at your destination on time. So, what’s the best way to put your hard-earned savings to work? Mercer Advisors believes it is factor investing, a strategy we implement for all of our clients.


Investing in Active Management: Does it pay?

Active management is best defined as an investment approach that relies on the use of a human element, typically a single manager or a team of managers, to actively manage a portfolio with the objective of outperforming a broad market index such as the S&P 500 Index. Active managers rely on in-house analytical research, forecasts, and their own judgment and experience in making investment decisions on what securities to buy, hold, and sell – and in what weights. Active managers believe markets are “inefficient” and that it’s possible to outperform the broad market by identifying and investing in mispriced stocks, bonds, and other securities. The opposite of active management is commonly referred to as “passive management” or “indexing.”

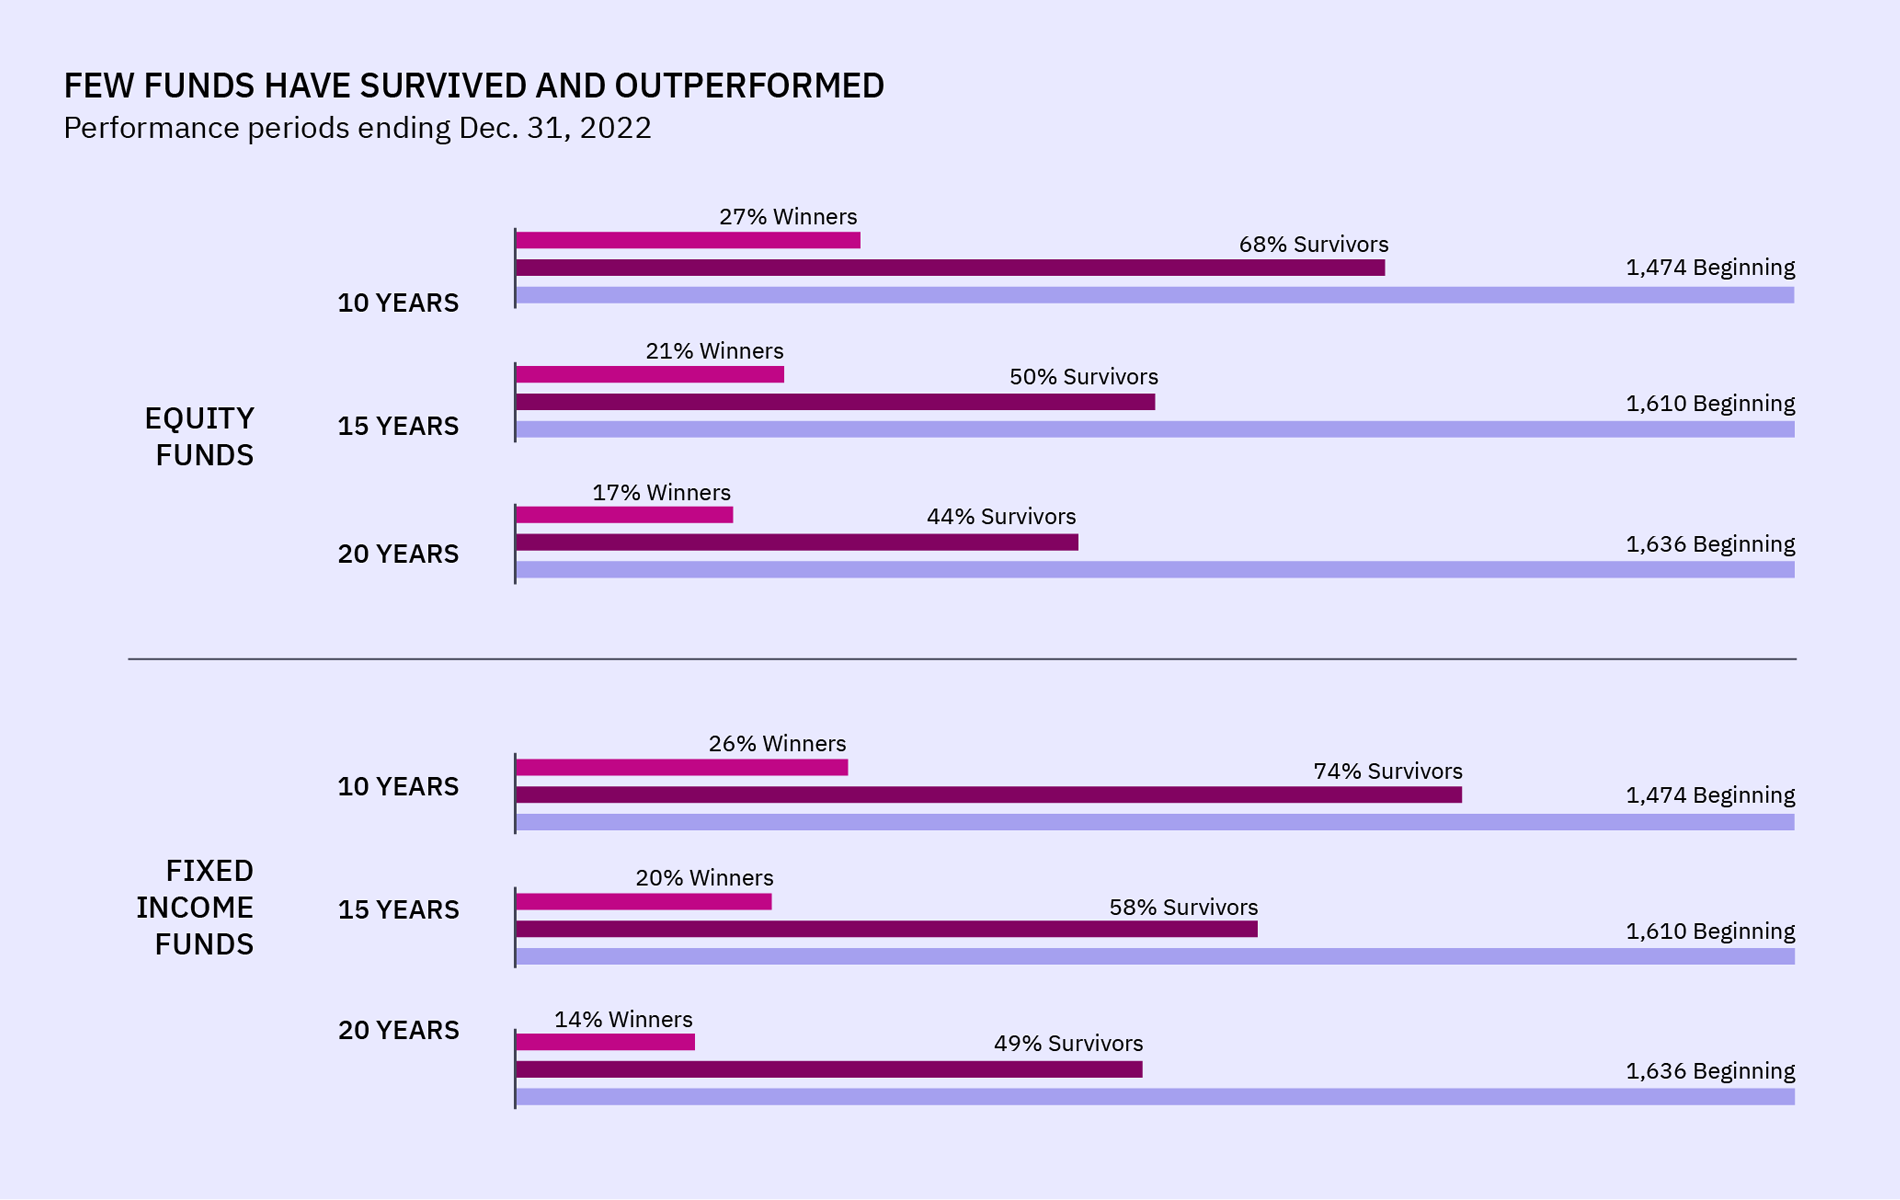
There is a certain romantic appeal to the notion that a financial guru can, against the odds, outperform the broad market through hard work, raw talent, or superior intellect. We see such outperformance in other areas of human endeavor, such as sports or standardized testing, where gifted individuals rise to the top to outperform their peers. However, outperformance in these areas doesn’t translate to financial markets where, in fact, many decades of real-world data conclusively show that nearly all active managers underperform a simple market index. Consider the below data that details mutual fund outperformance over the 15-year period ending December 31, 2017.


Exhibit A: Actively Managed Mutual Fund Manager Survival & Underperformance 2002-2017[1]

The odds of an actively managed mutual fund surviving longer than 15 years is about equal to that of winning a coin toss. Further, the odds of an actively managed fund outperforming its index are exceptionally low (14% for equity managers and 13% for bond managers).


Index Investing: If you can’t beat them, join them?

It’s precisely because of the poor results posted by active managers that indexing has become such a powerful force in investing. Firms such as Vanguard have grown tremendously over the past several decades due to the failure of active portfolio management to deliver value. Index investing has been shown to deliver superior returns, and at lower costs than active management, largely due to the high fees and poor diversification associated with active management—making it virtually impossible for such managers to beat their respective indexes.

The secret to indexing’s relative success rests on some very simple observations gleaned from financial theory. First, indexing embraces broad diversification within an asset class. For example, an S&P 500 Index fund purchases all 500 stocks in the index (or a statistically representative sample) rather than trying to divine which individual stocks out of all 500 will outperform in the quarter or year ahead. Both financial theory and mathematics tell us that there’s safety in numbers; more is better, both in terms of risk reduction and superior returns. Second, indexing embraces the efficient markets hypothesis (“EMH”), which postulates that the market “prices in” all publicly available information. If true, this means there are no arbitrage opportunities for active managers to capture risk-free returns. Finally, because indexing doesn’t rely on high-priced financial gurus or constant trading, index fund fees are significantly less expensive than their actively managed competitors, resulting in better returns.


Factor Investing: Science-Based Investing

The discussion, however, doesn’t stop at indexing. Walk into any graduate level investing or portfolio management course at any leading business school in the world, and you’ll find factor investing constitutes the core of the curriculum. And for good reason: factor investing is the modern manifestation of more than nine decades of scientific inquiry into financial markets.

Factors are defined as those quantifiable characteristics that have been shown to be reliable predictors of future outperformance. In equities, the most popular factors include value, quality, momentum, and size. With respect to bonds, factors include term (the length of time until the lender is repaid) and credit (the credit quality of the borrower). All are transparent and quantifiable using data pulled from publicly available financial statements, such as a firm’s balance sheet, income statement, or statement of cash flows.

Factor investing borrows from both indexing and active management. It embraces broad diversification; it does not seek to outperform by way of market timing or concentrating holdings in a handful of stocks or bonds, nor does factor investing attempt to identify mispriced securities.

It embraces the theory of market efficiency and subsequently benefits from low fees. Like active management, factor investing’s objective is to outperform the market. However, unlike active managers, factor investing aims to do so by taking a structured, process-driven approach to investing—not one reliant upon human judgment or experience, both of which are arbitrary and anecdotal (read: not scientific).

In contrast to active management and indexing alike, proponents of factor investing argue that certain assets outperform others for risk-based reasons, not because they’re mispriced. The central premise behind factor investing is that riskier investments are required to pay higher returns for the privilege of putting an investor’s capital to work. Think of the market as a highly competitive global auction with the users of capital (corporations and governments) on one side and the providers of capital (investors like you) on the other. Riskier companies and governments are required to pay higher returns to investors for the privilege of using their capital. We see this in markets all the time. For example, those with lower credit scores are required to pay a higher interest rate for a home mortgage, and vice versa. Financial markets—those markets seeking to put your savings to work—aren’t any different.

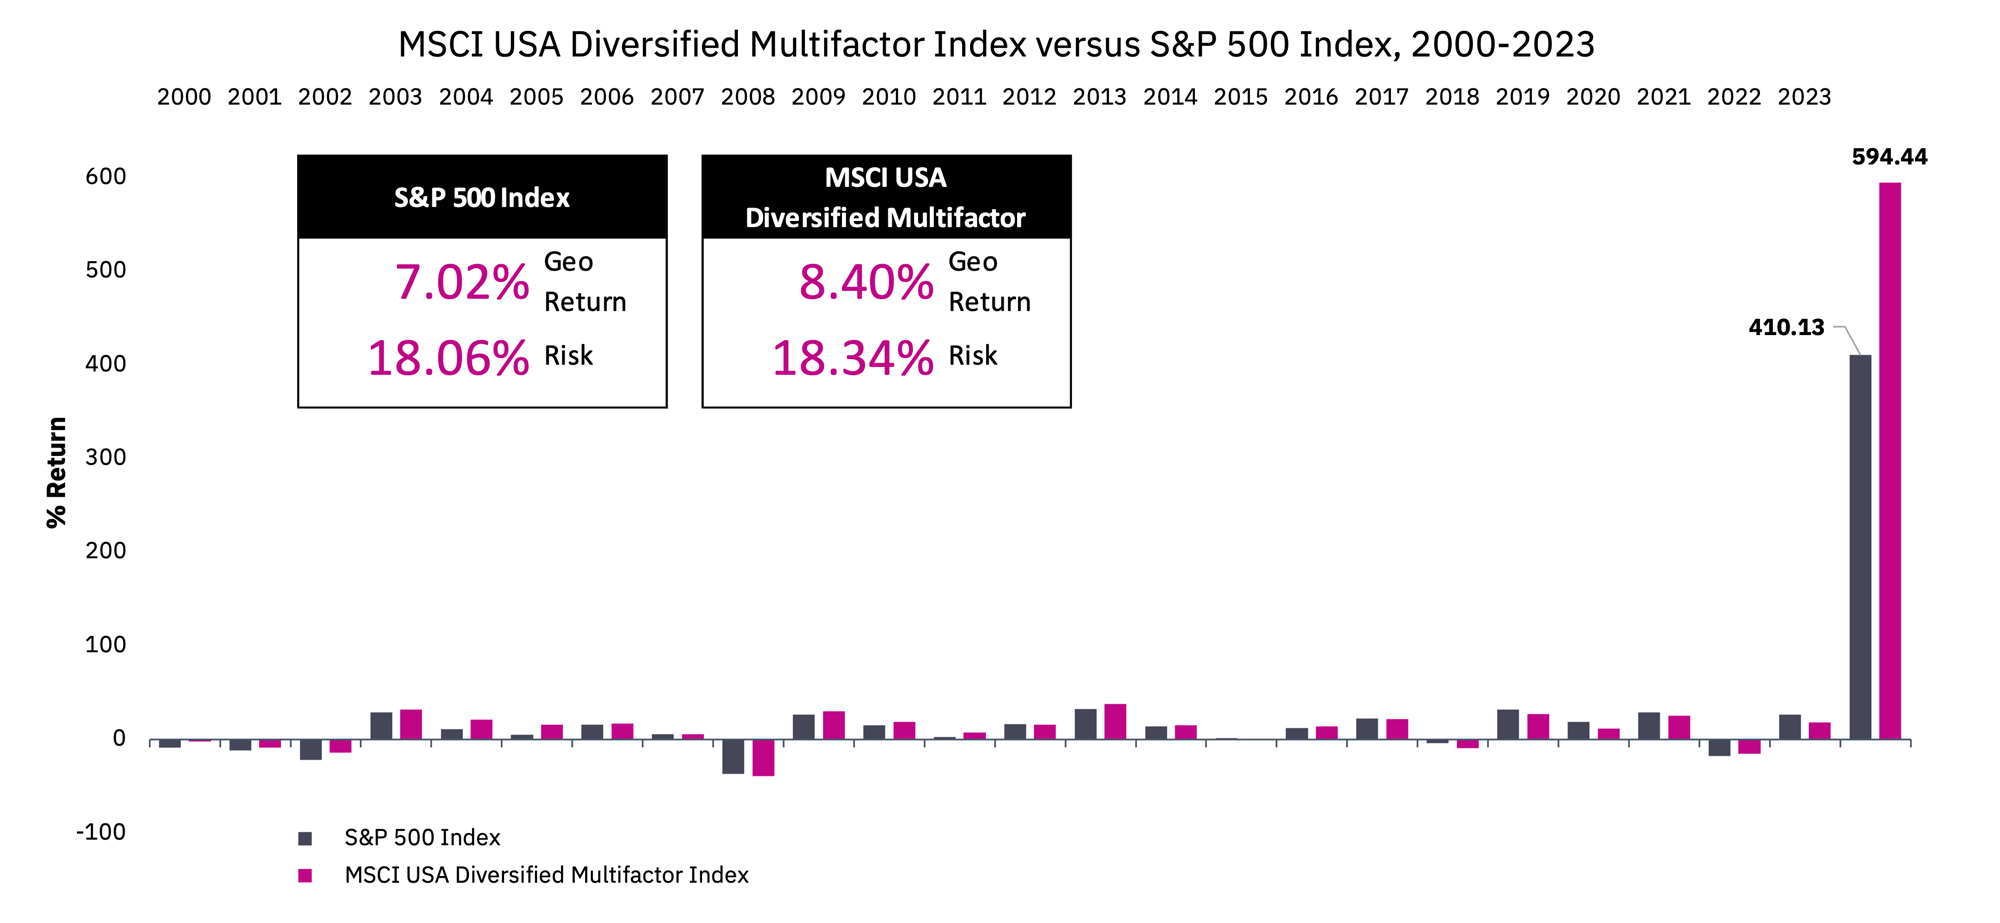
Does this mean factor investing is riskier than, say, indexing? Yes and no. While individual factors usually have higher risk than a typical index, by diversifying, these risks can be lowered without compromising returns. For example, from 2000 – 2018 the MSCI USA Diversified Multifactor Index—which invests in US stocks that exhibit the value, momentum, and quality factors—outperformed the S&P 500 Index by 2.87% with only 0.39% more risk[2].


Exhibit B: MSCI USA Diversified Multifactor Index versus S&P 500 Index, 2000 – 2018 [3]


Conclusion

There are three takeaways from this discussion. First, active management’s approach to investing is expensive, underperforms, and subjects your financial plan to unnecessary risk. Second, the low costs and diversification benefits associated with indexing help deliver better returns relative to active management. Finally, factor investing offers an intelligent, transparent, and rules-based alternative to both indexing and active management.

While there are never any guarantees in life, the best thinking available has been incorporated into the Mercer Advisors investment philosophy and strategy.


[1] Past performance is no guarantee of future results. The sample includes funds at the beginning of the 15-year period ending December 31, 2017. Each fund is evaluated relative to the Morningstar index assigned to the fund’s category at the start of the evaluation period. So, if, for example, a fund changes from Large Value to Large Growth during the evaluation period, then its return will still be compared to the Large Value category index. Surviving funds are those with return observations for every month of the sample period. Winner funds are those that survived and whose cumulative net return over the period exceeded that of their respective Morningstar category index. US-domiciled open-end mutual fund data is from Morningstar and Center for Research in Security Prices (CRSP) from the University of Chicago. Index funds and fund-of-funds are excluded from the sample. Equity fund sample includes the Morningstar historical categories: Diversified Emerging Markets, Europe Stock, Foreign Large Blend, Foreign Large Growth, Foreign Large Value, Foreign Small/Mid Blend, Foreign Small/Mid Growth, Foreign Small/Mid Value, Japan Stock, Large Blend, Large Growth, Large Value, Mid-Cap Blend, Mid-Cap Growth, Mid-Cap Value, Miscellaneous Region, Pacific/Asia ex-Japan Stock, Small Blend, Small Growth, Small Value, and World Stock. Fixed income fund sample includes the Morningstar historical categories: Corporate Bond, High Yield Bond, Inflation-Protected Bond, Intermediate Government, Intermediate-Term Bond, Muni California Intermediate, Muni California Long, Muni Massachusetts, Muni Minnesota, Muni National Intermediate, Muni National Long, Muni National Short, Muni New Jersey, Muni New York Intermediate, Muni New York Long, Muni Ohio, Muni Pennsylvania, Muni Single State Intermediate, Muni Single State Long, Muni Single State Short, Short Government, Short-Term Bond, Ultrashort Bond, and World Bond. See Dimensional’s “Data Appendix” for more detail. Index data provided by Bloomberg Barclays, MSCI, Russell, FTSE Fixed Income LLC, and S&P. Bloomberg Barclays data provided by Bloomberg. MSCI data © MSCI 2018, all rights reserved. Frank Russell Company is the source and owner of the trademarks, service marks, and copyrights related to the Russell Indexes. FTSE fixed income indices © 2018 FTSE Fixed Income LLC. All rights reserved. S&P data © 2018 S&P Dow Jones Indices LLC, a division of S&P Global. All rights reserved. Indices are not available for direct investment. Their performance does not reflect the expenses associated with management of an actual portfolio. There is no guarantee investment strategies will be successful. Past performance is no guarantee of future results.

[2] Source: FactSet, Inc. Returns for the MSCI USA Diversified Multifactor Index from 2000 – 2018.

[3] Back-tested performance is NOT an indicator of future actual results. Sources: FactSet, Inc. Historical performance results for investment indexes and/or categories generally do not reflect the deduction of transaction and/or custodial charges or the deduction of an investment-management fee, the incurrence of which would have the effect of decreasing historical performance results. Performance quoted is past performance and is not indicative of future results. Results are compared to the performance of the S&P 500 Index for informational purposes only. There is no guarantee that low-volatility stocks will provide low volatility. Factor investing is an investment strategy in which securities are chosen based on certain characteristics and attributes that may explain differences in returns. There can be no assurance that performance will be enhanced or risk will be reduced for funds that seek to provide exposure to certain factors. Exposure to such investment factors may detract from performance in some market environments, perhaps for extended periods. Factor investing may underperform cap-weighted benchmarks and increase portfolio risk. The returns shown are the geometric average returns of the S&P 500 Index and the MSCI USA Diversified Multifactor Index.  The geometric average return is also known as the compound average return.  The geometric return is technically defined as the nth root product of n numbers.

Mercer Advisors Inc. is the parent company of Mercer Global Advisors Inc. and is not involved with investment services. Mercer Global Advisors Inc. (“Mercer Advisors”) is registered as an investment advisor with the SEC. The firm only transacts business in states where it is properly registered, or is excluded or exempted from registration requirements.

All expressions of opinion reflect the judgment of the author as of the date of publication and are subject to change. Some of the research and ratings shown in this presentation come from third parties that are not affiliated with Mercer Advisors. The information is believed to be accurate, but is not guaranteed or warranted by Mercer Advisors. Content, research, tools, and stock or option symbols are for educational and illustrative purposes only and do not imply a recommendation or solicitation to buy or sell a particular security or to engage in any particular investment strategy. For financial planning advice specific to your circumstances, talk to a qualified professional at Mercer Advisors.

Past performance may not be indicative of future results. Therefore, no current or prospective client should assume that the future performance of any specific investment, investment strategy or product made reference to directly or indirectly, will be profitable or equal to past performance levels. All investment strategies have the potential for profit or loss. Changes in investment strategies, contributions or withdrawals may materially alter the performance and results of your portfolio. Different types of investments involve varying degrees of risk, and there can be no assurance that any specific investment will either be suitable or profitable for a client’s investment portfolio. Historical performance results for investment indexes and/or categories, generally do not reflect the deduction of transaction and/or custodial charges or the deduction of an investment-management fee, the incurrence of which would have the effect of decreasing historical performance results. Economic factors, market conditions, and investment strategies will affect the performance of any portfolio and there are no assurances that it will match or outperform any particular benchmark.

This article may contain forward-looking statements including statements regarding our intent, belief or current expectations with respect to market conditions. Readers are cautioned not to place undue reliance on these forward-looking statements. While due care has been used in the preparation of forecast information, actual results may vary in a materially positive or negative manner. Forecasts and hypothetical examples are subject to uncertainty and contingencies outside Mercer Advisors’ control.

Important Information Regarding Back-Tested Performance

  • Back-tested performance is NOT an indicator of future actual results.
  • Data for time periods prior to the index inception date is hypothetical and is provided for informational purposes only to indicate historical performance had the index been available over the relevant time period.
  • Index performance does not reflect any management fees, transaction costs or other expenses that would be incurred by a portfolio or fund, or brokerage commissions on transactions in fund shares. Such fees, expenses and commissions would reduce returns. Performance results shown include the reinvestment of dividends and interest on cash balances where applicable.
  • You cannot invest directly in any index. Index returns are for illustrative purposes only and do not represent any actual fund performance. A fund or portfolio may differ significantly from the securities included in an index.
  • Hypothetical data results are based on criteria applied retroactively with the benefit of hindsight and knowledge of factors that may have positively affected its performance, and cannot account for risk factors that may affect the actual fund performance. No hypothetical record can completely account for the impact of financial risk in actual trading. The actual performance of the fund may vary significantly from the hypothetical index performance due to transaction costs, liquidity or other market factors.
  • Any index performance data appearing in this presentation has been compiled by the respective copyright holders, trademark holders, or publication/distribution right owners of each index for comparison purposes only.
  • A decision to invest in any such fund or portfolio should not be made in reliance on any of the statements set forth in this presentation. Presentation of MSCI Factor Indexes is meant to educate clients and is not a recommendation by Mercer Advisors to buy, sell, or hold such a security, nor is it considered to be investment advice.
  • Information presented prior to the launch date of any index is back-tested. Back-tested performance is not actual performance, but is hypothetical. Back-tested calculations are based on the same methodology that was in effect when the index was officially launched. However, it should be noted that the historic calculations of an economic index may change from month to month based on revisions to the underlying economic data used in the calculation of the index. Another limitation of using back-tested information is that the back-tested calculation is generally prepared with the benefit of hindsight.

Important Information Regarding Indices

  • The S&P 500 Index is a widely accepted gauge of the US equity market. The index includes a representative sample of 500 leading companies in leading industries of the US economy. The S&P 500 Index focuses on the large-cap segment of the market; however, since it includes a significant portion of the total value of the market, it also represents the market.
  • The MSCI USA Enhanced Value Index captures large- and mid-cap US securities exhibiting overall value style characteristics. The value investment style characteristics for index construction are defined using three variables: book value to price, 12-month forward earnings to price, and Enterprise Value to Cash Flow from Operations.
  • The MSCI USA Quality Index is based on the MSCI USA Index, its parent index, which includes large- and mid-cap stocks in the US equity market. The index aims to capture the performance of quality growth stocks by identifying stocks with high quality scores based on three main fundamental variables: high return on equity (ROE), stable year-over-year earnings growth, and low financial leverage. The MSCI Quality Indexes complement existing MSCI Factor Indexes and can provide an effective diversification role in a portfolio of factor strategies.
  • The MSCI USA Momentum Index is based on MSCI USA Index, its parent index, which captures large- and mid-cap stocks of the US market. It is designed to reflect the performance of an equity momentum strategy by emphasizing stocks with high price momentum, while maintaining reasonably high trading liquidity, investment capacity and moderate index turnover.
  • The MSCI USA Minimum Volatility (USD) Index aims to reflect the performance characteristics of a minimum variance strategy applied to the large- and mid-cap USA equity universe. The index is calculated by optimizing the MSCI USA Index, its parent index, in USD for the lowest absolute risk (within a given set of constraints).
  • The MSCI USA Index is designed to measure the performance of the large- and mid-cap segments of the US market. With 620 constituents, the index covers approximately 85% of the free float-adjusted market capitalization in the US.
  • The MSCI USA Diversified Multiple-Factor Index is based on a traditional market cap weighted parent index, the MSCI USA Index, which includes US large- and mid-cap stocks. The index aims to maximize exposure to four factors – Value, Momentum, Quality and Low Size – while maintaining a risk profile similar to that of the underlying parent index. The MSCI Diversified Multiple-Factor Indexes are constructed by optimizing from an underlying Parent Index using a Barra Equity Model to maximize the index-level exposure to the targeted style factors while maintaining market risk similar to the Parent Index.
  • The indices listed have been selected for purposes of comparing performance with widely-known, broad-based benchmarks. Performance may or may not correlate to any of these indices and should not be considered as a proxy for any of these indices.

Important Information Regarding the MSCI US Factor Indexes

  • Source data provided by FactSet.
  • The use of a representative index as a proxy for performance data has inherent limitations as it does not reflect the performance of the holding or asset manager and is therefore hypothetical by nature.
  • Representative indexes do not represent actual trading and they may not reflect the impact that material economic and market factors might have had on an actively managed account. The actual holding’s or asset manager’s performance result will vary, perhaps significantly.
  • In addition, while the indexes utilized were selected as representative of the holding or strategy, there can be no assurance that other indices not used may have characteristics similar or superior to those used in this presentation. Indexes are used to represent the performance of certain sectors of the overall securities market.
  • MSCI Factor Indexes are rules-based, transparent indexes targeting stocks with favorable factor characteristics – as backed by robust academic findings and empirical results – and are designed for simple implementation, replicability, and use for both traditional passive and active mandates.
  • Factors are key drivers of risk and return and through advancements in data and technology can be accessed through Factor Indexes. Factor Indexes offer investors a basis to seek the return premium historically provided by certain factor-based strategies.
  • MSCI Indexes are net return indexes that include reinvesting the after-tax dividends.
  • There can be no assurance that performance will be enhanced or risk will be reduced for funds that seek to provide exposure to certain factors. Exposure to such investment factors may detract from performance in some market environments, perhaps for extended periods. Factor investing may underperform cap-weighted benchmarks and increase portfolio risk.
  • Cumulative returns for the S&P 500 Index and MSCI Indexes both assume an initial investment was made on January 1, 2000 and remained fully invested for the period beginning January 1, 2000 and ending December 31, 2018.
  • Mercer Advisors portfolios are not sponsored, endorsed, or promoted by MSCI, and MSCI Inc. bears no liability with respect to any such funds or any index on which such funds are based. Mercer Advisors receives no compensation in connection with use of MSCI indices. All information relating to any MSCI index is impersonal and not tailored to the specific financial circumstances of any person, entity or group of persons.
  • Index methodologies are available at https://www.msci.com/.

Index Name (Based on daily factor data.); Inception Date; Dates of Index Returns

  • MSCI USA Index; March 31, 1986; 1/1/2000 – 12/31/2018
  • MSCI USA Enhanced Value Index; December 08, 1997; 1/1/2000 – 12/31/2018
  • MSCI USA Momentum Index; February 15, 2013; 1/1/2000 – 12/31/2018
  • MSCI USA Quality Index;December 18, 2012 1/1/2000; – 12/31/2018
  • MSCI USA Minimum Volatility Index; June 02, 2008; 1/1/2000 – 12/31/2018
  • MSCI USA Diversified Multifactor Small Cap Index; February 17, 2015; 1/1/2000 – 12/31/2018
  • MSCI USA Diversified Multifactor Index; February 17, 2015; 1/1/2000 – 12/31/2018