Despite strong YTD returns for equities, global stock and bond markets saw a notable selloff in the final two months of the third quarter. From July 31 to October 5, the S&P 500 declined 5.8% and the Bloomberg U.S. Aggregate Bond Index dropped 4.3%. While equity returns remained positive for the year, the recent selloff prompted many to question why U.S. markets (seemingly) saw a sudden turn of events. Keep in mind, global stock and bond markets sold off since late July, but our focus here is mostly on U.S. markets.
Putting the recent selloff in historical context
Let’s first set some context. The recent selloff in both equities and fixed income is not abnormal. The declines are quite normal and very much in line with market history. Consider the S&P 500 Index, which fell 5.8% from late July through early October. Earlier this year, between February 2 and March 10, the index fell 8%, before rallying and reaching its YTD 2023 peak in late July. If these ups and downs seem extreme, they shouldn’t. Since 1980, the average intra-year drop in the S&P 500 Index is 14.3%, indicating that 2023’s downside volatility has been below normal, according to JPMorgan’s recent Guide to the Markets (Exhibit A).
Exhibit A: S&P 500 intra-year declines versus calendar year returns
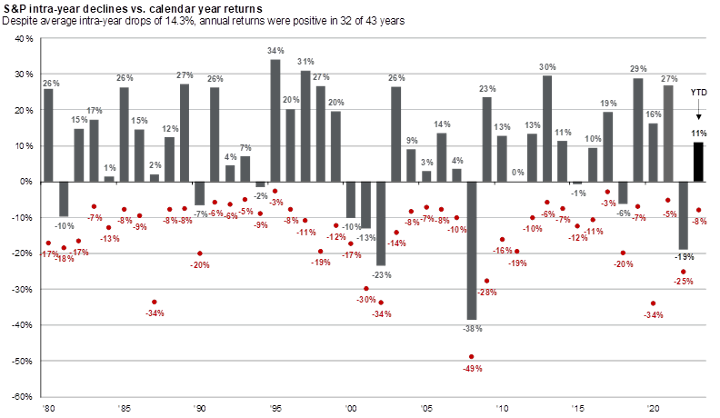
(Source: JPMorgan’s Guide to the Markets, October 5, 2023, slide 15)
Returns are based on price index only and do not include dividends. Intra-year drops refers to the largest market drops from a peak to a trough during the year. For illustrative purposes only. Returns shown are calendar year returns from 1980 to 2022, over which time period the average annual return was 8.7%. Guide to the Markets – U.S. Data are as of September 30, 2023
For the Bloomberg U.S. Aggregate Bond Index, the average intra-year drop is 3.3%. While the index dipped 4.3% from late July to early October, it fell a more significant 6.5% from its 2023 peak on April 5. This represents an intra-year volatility about twice that of its long-term average. However, this isn’t unprecedented by any stretch; on several occasions, the index saw similar or more extreme drawdowns (Exhibit B).
Exhibit B: Bloomberg U.S. Aggregate Index intra-year declines versus calendar year returns
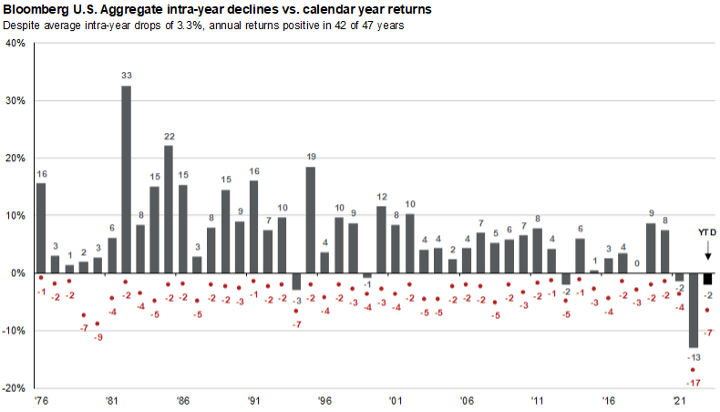
(Source: JPMorgan’s Guide to the Markets, October 5, 2023, slide 42)
Returns are based on total return. Intra-year drops refers to the largest market drops from a peak to a trough during the year. For illustrative purposes only. Returns shown are calendar year returns from 1976 to 2022, over which time period the average annual return was 6.6%. Returns from 1976 to 1989 are calculated on a monthly basis; daily data are used afterward. Guide to the Markets – U.S. Data are as of September 30, 2023.
What’s driving markets lower?
In our view, a few usual suspects quickly rise to the top—all of them normal, all of them to be reasonably expected.
- Oil prices: Oil prices rose nearly 10% in September in response to planned production cuts by Saudi Arabia. The price of oil functions like a tax on consumers; the higher the price of gasoline, the less consumers have (and are likely) to spend on other goods and services, which can drag on the economy, earnings, and stock prices. While oil prices declined during the first week of October, shocking events in Gaza and Israel will likely push oil prices even higher for a period of time.
- UAW strike: Some economists (e.g., Moody’s Analytics) argue that the UAW strike against the Big Three automakers will shave somewhere between 0.1% to 0.2% off U.S. GDP growth per week. The longer it lasts, the greater the impact is likely to be. While this is probably true, the strike’s immediate impact on markets and the broader economy remains unclear. The Atlanta Fed’s GDPNow model estimates current U.S. GDP growth of 4.9% as of October 5, suggesting the U.S. economy has a long way to go before the UAW strike meaningfully impacts GDP growth. Nevertheless, from September 15 through October 5, the UAW strike appeared to marginally impact the stock prices of the Big Three (GM has been hit the hardest, down 9.7% since then, followed by Ford [-4.9%] and Stellantis [-1.45%]).
- Rising interest rates: Arguably, rising interest rates are the most significant factor driving equity markets lower. The yield on the 10-year U.S. Treasury bond rose nearly 100 basis points from early August to early October, a significant move. By late September, mortgage rates for a 30-year mortgage were rapidly approaching 8%, their highest level since 2000. Higher rates put downward pressure on the asset prices of everything from stocks and bonds to real estate and pet rocks. But this begs the question: Given the Federal Reserve didn’t raise rates at its September FOMC meeting, why do rates continue to rise?
- The Fed: The Federal Reserve has explicitly communicated that they’ll likely raise rates again in the near future and that rates will very likely stay higher for longer (suggesting the Fed probably won’t cut rates in 2024 as much as previously expected). The Fed’s position isn’t surprising. While inflation has come down significantly from its 2022 highs, it remains well above the central bank’s 2% target. And inflation increased slightly in August. Further, some recent economic data (on inflation, jobs, and GDP growth) suggest the Fed will likely keep rates higher for longer to reign in inflationary pressure throughout the U.S. economy.
- Rising U.S. government debt: No discussion of rising rates would be complete without mentioning the growth in federal debt. The federal deficit for fiscal year 2023 is forecast to be $1.4 trillion, adding to the estimated $32.3 trillion in federal debt outstanding. Further, while both parties in Congress came together in early June to narrowly avert a first ever government default on U.S. federal debt—and in late September, to avert a U.S. government shutdown—the chaotic and dysfunctional political environment in Washington seemed to fail to convince bond investors of brighter, more responsible days ahead.
Takeaways for investors
No one likes market volatility, but we think it’s important to step back and look at the big picture. When we do, several important silver linings come into focus with respect to today’s markets.
For those long-term investors focused on building wealth, hedging long-term inflation, or seeking dividend income, today’s lower stock valuations are a good thing. Lower valuations mean cheaper entry points for investors. The S&P 500 now trades at 17.7 times next year’s earnings. That’s still above its long-term average of 16 times earnings, but it’s down from over 19 times earnings in July and from over 22 times earnings in late 2021. U.S. value stocks, many of them high dividend payers, trade at an attractive valuation of only 13.4 times earnings (versus a frothy 24.5 times earnings for low or non-dividend paying growth stocks).
For those investors seeking less risk, income, or broad asset class diversification, today’s higher interest rates are a breath of fresh air from years of financial repression by the Federal Reserve The prior decades near zero interest rate policies forced many retirees and other income-focused investors into taking credit and duration risks that they otherwise wouldn’t. Today, higher interest rates on everything from money markets and Treasury bonds to mortgage bonds and corporate debt provide investors with a range of better income-generating options and better tools for building diversified portfolios.
Finally, today’s higher rates arguably create a healthier market ecosystem for all investors since higher rates tend to enforce greater financial discipline on corporate managers (higher rates means higher break-evens for pet projects, acquisitions, etc.). Gone are the days when free or cheap money rendered asset prices meaningless (when money is free, price doesn’t matter), which ultimately led to an explosion in unprofitable companies and likely fueled the exorbitant valuations and anomalous returns of many growth companies over the past 10 to15 years (Exhibit C). Those days are hopefully now behind us, and, in our view, that would be a good thing for all investors, regardless of risk tolerance or investment objective.
Exhibit C: Higher interest rates should result in fewer unprofitable companies in the market
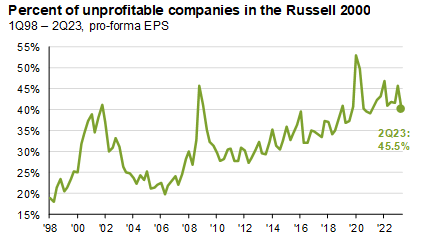
(Source: JPMorgan’s Guide to the Markets, October 5, 2023, slide 12).
Intra-year market declines can be unnerving, even for experienced investors who have navigated previous bear markets. However, putting this year’s decline in historical perspective shows that the volatility isn’t unusual and is, in fact, below the norm. While several factors (higher interest rates, rising oil prices, and loose fiscal policy) have conspired to weigh on U.S. bonds and equities, there are positive developments that warrant consideration. When viewed from a longer-term perspective, these silver linings suggest that there are an equal number of reasons to be bullish as there are for being bearish.


Home » Insights » Market Commentary » Perspectives on a Two-Month Stock and Bond Markets Selloff
Perspectives on a Two-Month Stock and Bond Markets Selloff
Donald Calcagni, MBA, MST, CFP®, AIF®
Chief Investment Officer
In turbulent times, take a step back and find the silver linings. Volatility can offer valuable investment opportunities.
Despite strong YTD returns for equities, global stock and bond markets saw a notable selloff in the final two months of the third quarter. From July 31 to October 5, the S&P 500 declined 5.8% and the Bloomberg U.S. Aggregate Bond Index dropped 4.3%. While equity returns remained positive for the year, the recent selloff prompted many to question why U.S. markets (seemingly) saw a sudden turn of events. Keep in mind, global stock and bond markets sold off since late July, but our focus here is mostly on U.S. markets.
Putting the recent selloff in historical context
Let’s first set some context. The recent selloff in both equities and fixed income is not abnormal. The declines are quite normal and very much in line with market history. Consider the S&P 500 Index, which fell 5.8% from late July through early October. Earlier this year, between February 2 and March 10, the index fell 8%, before rallying and reaching its YTD 2023 peak in late July. If these ups and downs seem extreme, they shouldn’t. Since 1980, the average intra-year drop in the S&P 500 Index is 14.3%, indicating that 2023’s downside volatility has been below normal, according to JPMorgan’s recent Guide to the Markets (Exhibit A).
Exhibit A: S&P 500 intra-year declines versus calendar year returns
(Source: JPMorgan’s Guide to the Markets, October 5, 2023, slide 15)
Returns are based on price index only and do not include dividends. Intra-year drops refers to the largest market drops from a peak to a trough during the year. For illustrative purposes only. Returns shown are calendar year returns from 1980 to 2022, over which time period the average annual return was 8.7%. Guide to the Markets – U.S. Data are as of September 30, 2023
For the Bloomberg U.S. Aggregate Bond Index, the average intra-year drop is 3.3%. While the index dipped 4.3% from late July to early October, it fell a more significant 6.5% from its 2023 peak on April 5. This represents an intra-year volatility about twice that of its long-term average. However, this isn’t unprecedented by any stretch; on several occasions, the index saw similar or more extreme drawdowns (Exhibit B).
Exhibit B: Bloomberg U.S. Aggregate Index intra-year declines versus calendar year returns
(Source: JPMorgan’s Guide to the Markets, October 5, 2023, slide 42)
Returns are based on total return. Intra-year drops refers to the largest market drops from a peak to a trough during the year. For illustrative purposes only. Returns shown are calendar year returns from 1976 to 2022, over which time period the average annual return was 6.6%. Returns from 1976 to 1989 are calculated on a monthly basis; daily data are used afterward. Guide to the Markets – U.S. Data are as of September 30, 2023.
What’s driving markets lower?
In our view, a few usual suspects quickly rise to the top—all of them normal, all of them to be reasonably expected.
Takeaways for investors
No one likes market volatility, but we think it’s important to step back and look at the big picture. When we do, several important silver linings come into focus with respect to today’s markets.
For those long-term investors focused on building wealth, hedging long-term inflation, or seeking dividend income, today’s lower stock valuations are a good thing. Lower valuations mean cheaper entry points for investors. The S&P 500 now trades at 17.7 times next year’s earnings. That’s still above its long-term average of 16 times earnings, but it’s down from over 19 times earnings in July and from over 22 times earnings in late 2021. U.S. value stocks, many of them high dividend payers, trade at an attractive valuation of only 13.4 times earnings (versus a frothy 24.5 times earnings for low or non-dividend paying growth stocks).
For those investors seeking less risk, income, or broad asset class diversification, today’s higher interest rates are a breath of fresh air from years of financial repression by the Federal Reserve The prior decades near zero interest rate policies forced many retirees and other income-focused investors into taking credit and duration risks that they otherwise wouldn’t. Today, higher interest rates on everything from money markets and Treasury bonds to mortgage bonds and corporate debt provide investors with a range of better income-generating options and better tools for building diversified portfolios.
Finally, today’s higher rates arguably create a healthier market ecosystem for all investors since higher rates tend to enforce greater financial discipline on corporate managers (higher rates means higher break-evens for pet projects, acquisitions, etc.). Gone are the days when free or cheap money rendered asset prices meaningless (when money is free, price doesn’t matter), which ultimately led to an explosion in unprofitable companies and likely fueled the exorbitant valuations and anomalous returns of many growth companies over the past 10 to15 years (Exhibit C). Those days are hopefully now behind us, and, in our view, that would be a good thing for all investors, regardless of risk tolerance or investment objective.
Exhibit C: Higher interest rates should result in fewer unprofitable companies in the market
(Source: JPMorgan’s Guide to the Markets, October 5, 2023, slide 12).
Intra-year market declines can be unnerving, even for experienced investors who have navigated previous bear markets. However, putting this year’s decline in historical perspective shows that the volatility isn’t unusual and is, in fact, below the norm. While several factors (higher interest rates, rising oil prices, and loose fiscal policy) have conspired to weigh on U.S. bonds and equities, there are positive developments that warrant consideration. When viewed from a longer-term perspective, these silver linings suggest that there are an equal number of reasons to be bullish as there are for being bearish.
Explore More
Making a Backdoor or Mega Backdoor Roth Contribution in 2026
Why Disability Insurance Remains Essential in 2026
Q2 Market Outlook: Markets, Interest Rates, Inflation, and More
Mercer Advisors Inc. is the parent company of Mercer Global Advisors Inc. and is not involved with investment services. Mercer Global Advisors Inc. (“Mercer Advisors”) is registered as an investment advisor with the SEC. The firm only transacts business in states where it is properly registered or is excluded or exempted from registration requirements.
All expressions of opinion reflect the judgment of the author as of the date of publication and are subject to change. Some of the research and ratings shown in this presentation come from third parties that are not affiliated with Mercer Advisors. The information is believed to be accurate but is not guaranteed or warranted by Mercer Advisors. Content, research, tools and stock or option symbols are for educational and illustrative purposes only and do not imply a recommendation or solicitation to buy or sell a particular security or to engage in any particular investment strategy. For financial planning advice specific to your circumstances, talk to a qualified professional at Mercer Advisors.
Past performance may not be indicative of future results. Therefore, no current or prospective client should assume that the future performance of any specific investment, investment strategy or product made reference to directly or indirectly, will be profitable or equal to past performance levels. All investment strategies have the potential for profit or loss. Changes in investment strategies, contributions or withdrawals may materially alter the performance and results of your portfolio. Different types of investments involve varying degrees of risk, and there can be no assurance that any specific investment will either be suitable or profitable for a client’s investment portfolio. Diversification does not ensure a profit or guarantee against loss. Historical performance results for investment indexes and/or categories, generally do not reflect the deduction of transaction and/or custodial charges or the deduction of an investment-management fee, the incurrence of which would have the effect of decreasing historical performance results. Economic factors, market conditions, and investment strategies will affect the performance of any portfolio and there are no assurances that it will match or outperform any particular benchmark.
This document may contain forward-looking statements including statements regarding our intent, belief or current expectations with respect to market conditions. Readers are cautioned not to place undue reliance on these forward-looking statements. While due care has been used in the preparation of forecast information, actual results may vary in a materially positive or negative manner. Forecasts and hypothetical examples are subject to uncertainty and contingencies outside Mercer Advisors’ control.
Certified Financial Planner Board of Standards, Inc. (CFP Board) owns the CFP® certification mark, the CERTIFIED FINANCIAL PLANNER® certification mark, and the CFP® certification mark (with plaque design) logo in the United States, which it authorizes use of by individuals who successfully complete CFP Board’s initial and ongoing certification requirements.