

As we approach the 2026 midterm elections, many investors are wondering about the potential impact on their portfolios. It’s natural that politics and elections often generate anxiety because the stakes of democracy are high. It’s precisely because emotions run high around elections that grounding our investing approach in data is important. The data tell us a clear story: Politics and investing don’t mix.
People tend to believe that their preferred party controlling Congress will be better for the markets and the economy, or to worry about the economic impacts if the other party is in power. Because many investors care deeply about politics, they often believe that a shift in the balance of power on Capitol Hill could have obvious and significant impacts on their portfolios.
The data simply don’t support that conclusion. The evidence is ambiguous, at best, that one political party is any better than the other for markets or the economy, and because of this, we don’t recommend any changes in investment strategies based on what anyone expects to happen in the election.
The long-run perspective
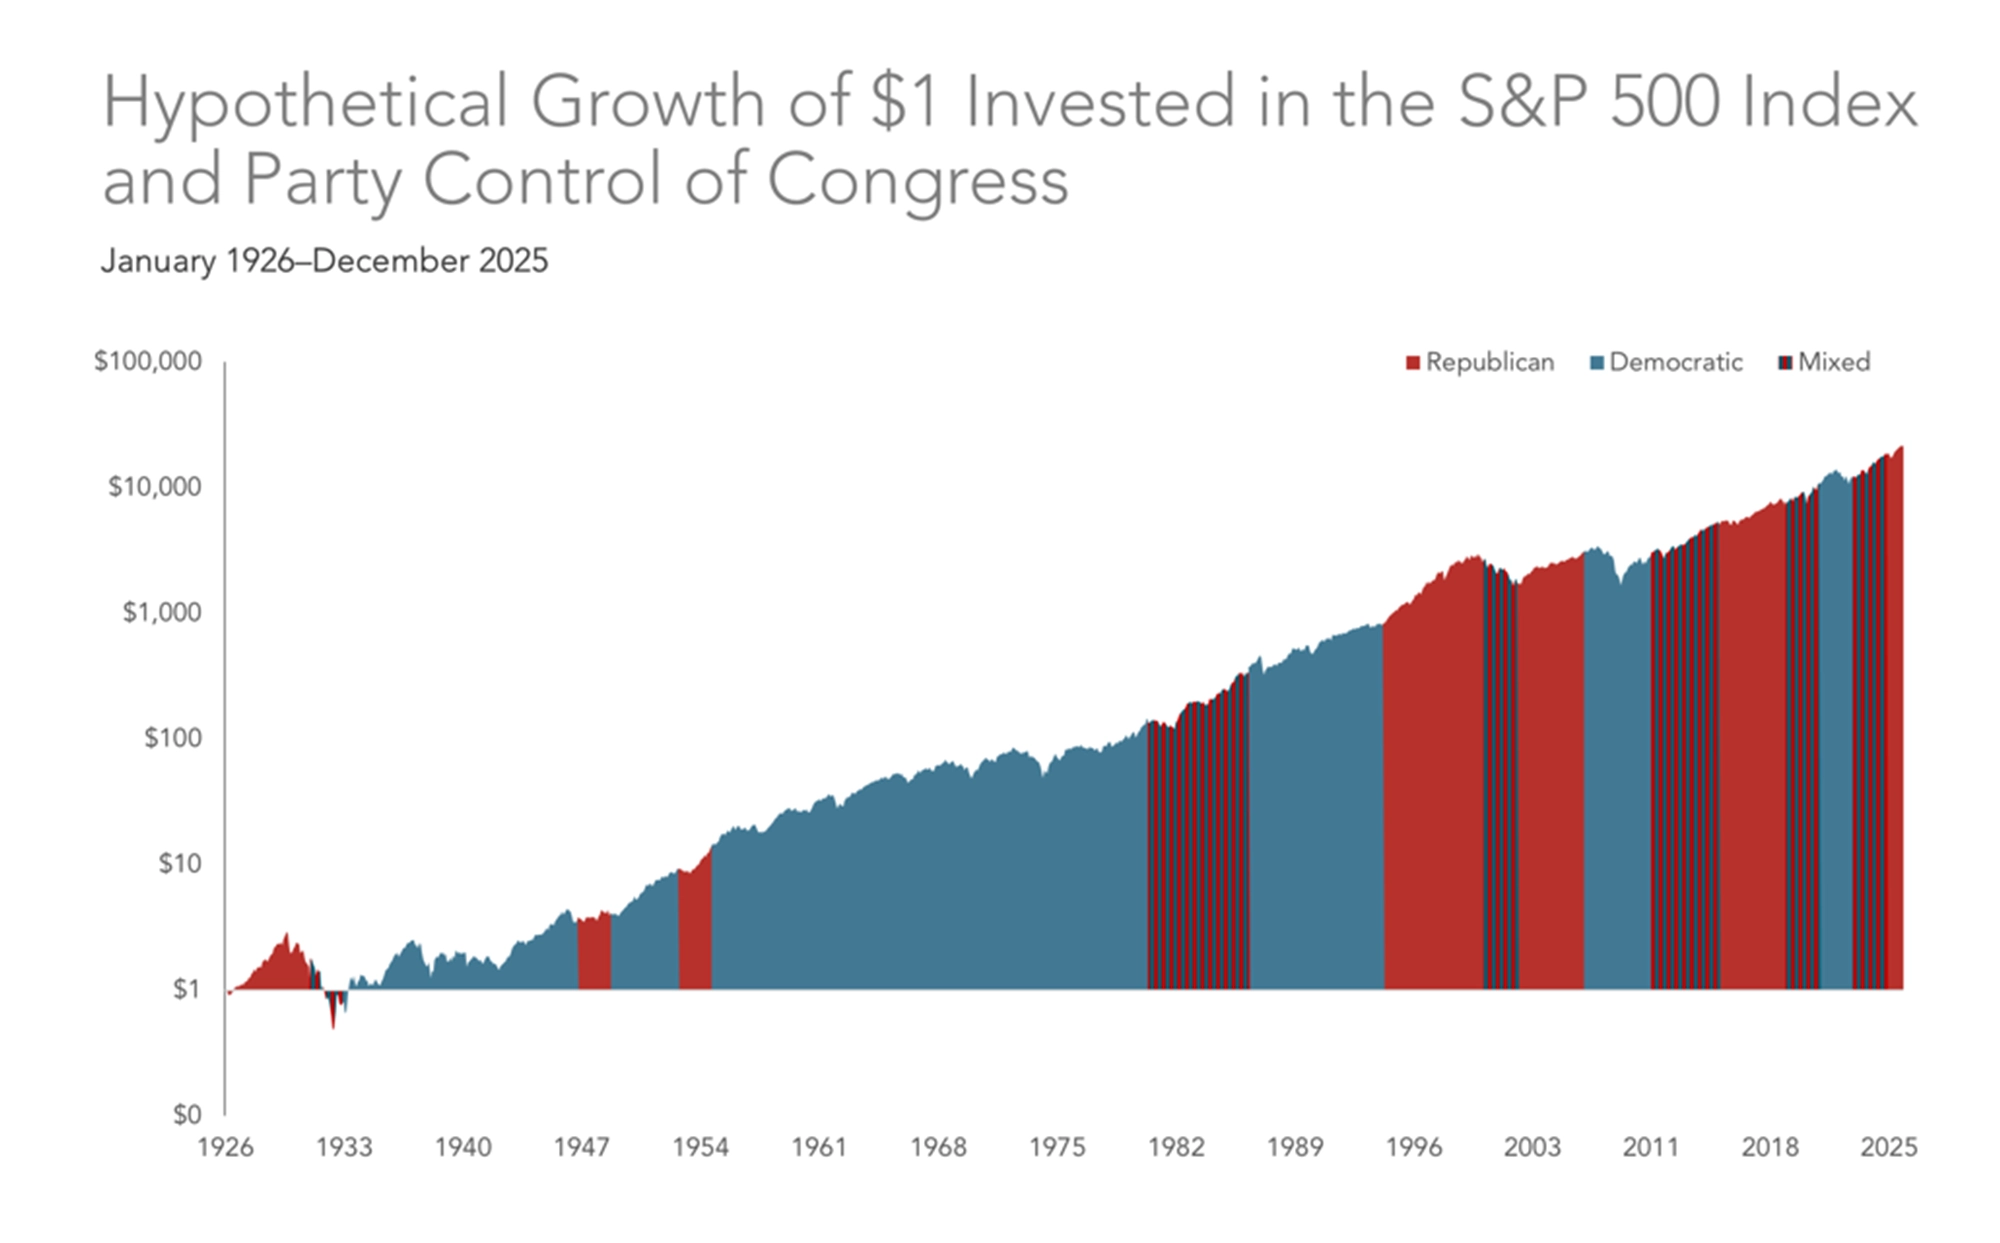
Taking a long view since 1926, the S&P 500 has trended upward under both Democratic and Republican administrations, regardless of which party controlled Congress. This is not to say that policies don’t matter, only that they don’t impact the market in a predictable way around which one can time investments.
Figure 1: Hypothetical growth of $1 invested in the S&P 500 index and party control of Congress
Source: Dimensional.
Past performance is not a guarantee of future results. Indices are not available for direct investment; therefore, their performance does not reflect the expenses associated with the management of an actual portfolio. Data presented in the growth of $1 chart is hypothetical and assumes reinvestment of income and no transaction costs or taxes. The chart is for illustrative purposes only and is not indicative of any investment.
Source: S&P data ©2024 S&P Dow Jones Indices LLC, a division of S&P Global. All rights reserved.
Why might the link between politics and markets be so hard to find?
A number of reasons exist as to why we find no reliable correlation between which party controls Congress and market returns. Congress writes and passes legislation and sets spending policy, but even a unified Congress must work with the White House, and they don’t always agree. Many key economic policies remain largely unchanged from one Congress to the next, and other key policymakers, such as the Federal Reserve’s governors, serve terms that don’t align with the political calendar. Altogether, this means that much about the economy remains the same regardless of election outcomes, and the things that do change don’t necessarily change the moment voters decide an election.
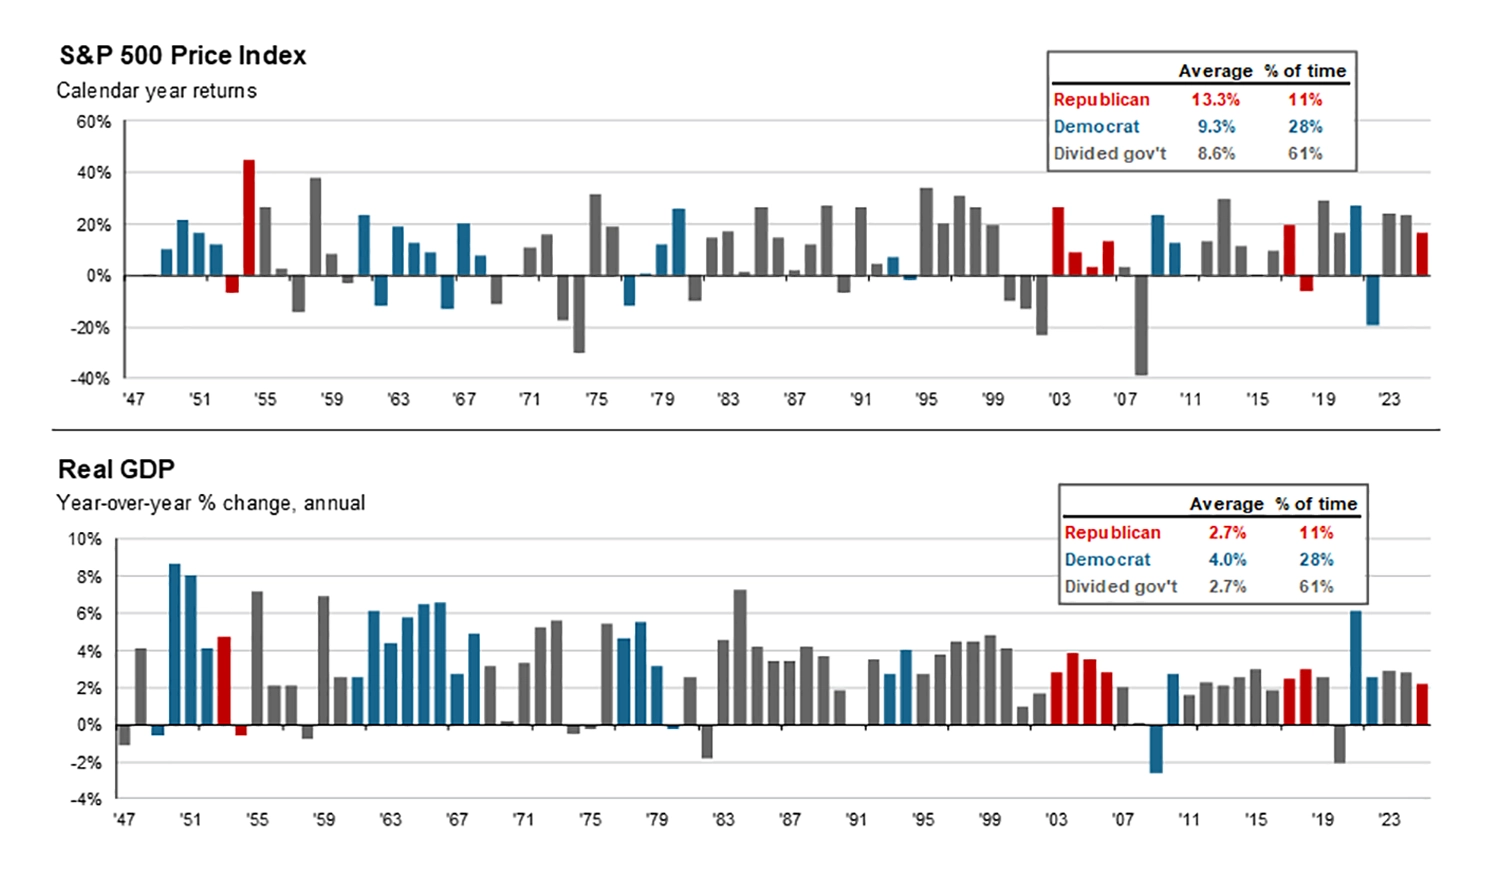
Figure 2: S&P 500 Index and Real GDP under different political configurations
Source: BEA, Standard & Poor’s, FactSet, J.P. Morgan Asset Management. Data are calendar year. Guide to the Markets – U.S. Data are as of Sept. 18, 2026.



As shown in Figure 2, on average, markets have climbed 13.3% while real gross domestic product (GDP) has increased 2.7% under unified Republican control, while markets have risen 9.3% and real GDP has increased 4% under unified Democratic control. Under periods of divided government — the most common situation historically — markets have risen 8.6% and GDP has climbed 2.7%.
The important thing to keep in mind is that none of this implies a reliable cause-and-effect relationship between party control and market returns or GDP growth. The point is simply that regardless of the government’s political configuration, the economy has typically grown and the market has typically risen.
What midterms and the presidential cycle tell us
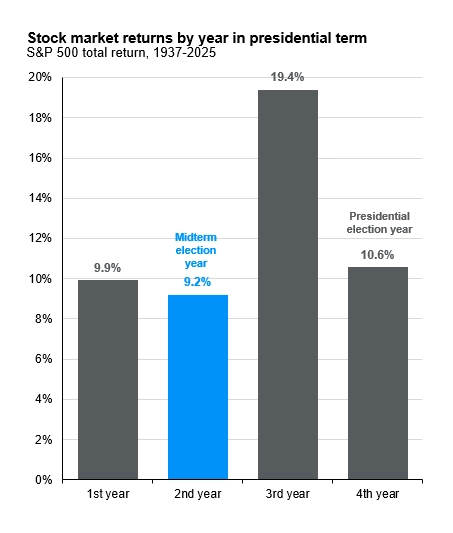
One of the more consistent historical patterns worth noting is how markets tend to behave around midterm elections. Midterms historically introduce uncertainty about the direction of policy, the balance of power, and the ability of the White House to advance its agenda. When uncertainty is reduced, markets often respond positively, which could be influenced by various factors, including election outcomes. Historically, the 12-month period following midterm elections has been the strongest stretch for market performance in the four-year presidential cycle.
Figure 3: Stock market returns by year in presidential term
Source: Factset, Standard & Poor’s, U.S. House of Representatives, U.S. Senate, White House, J.P. Morgan Asset Management. Data are as of Sept. 18, 2026.
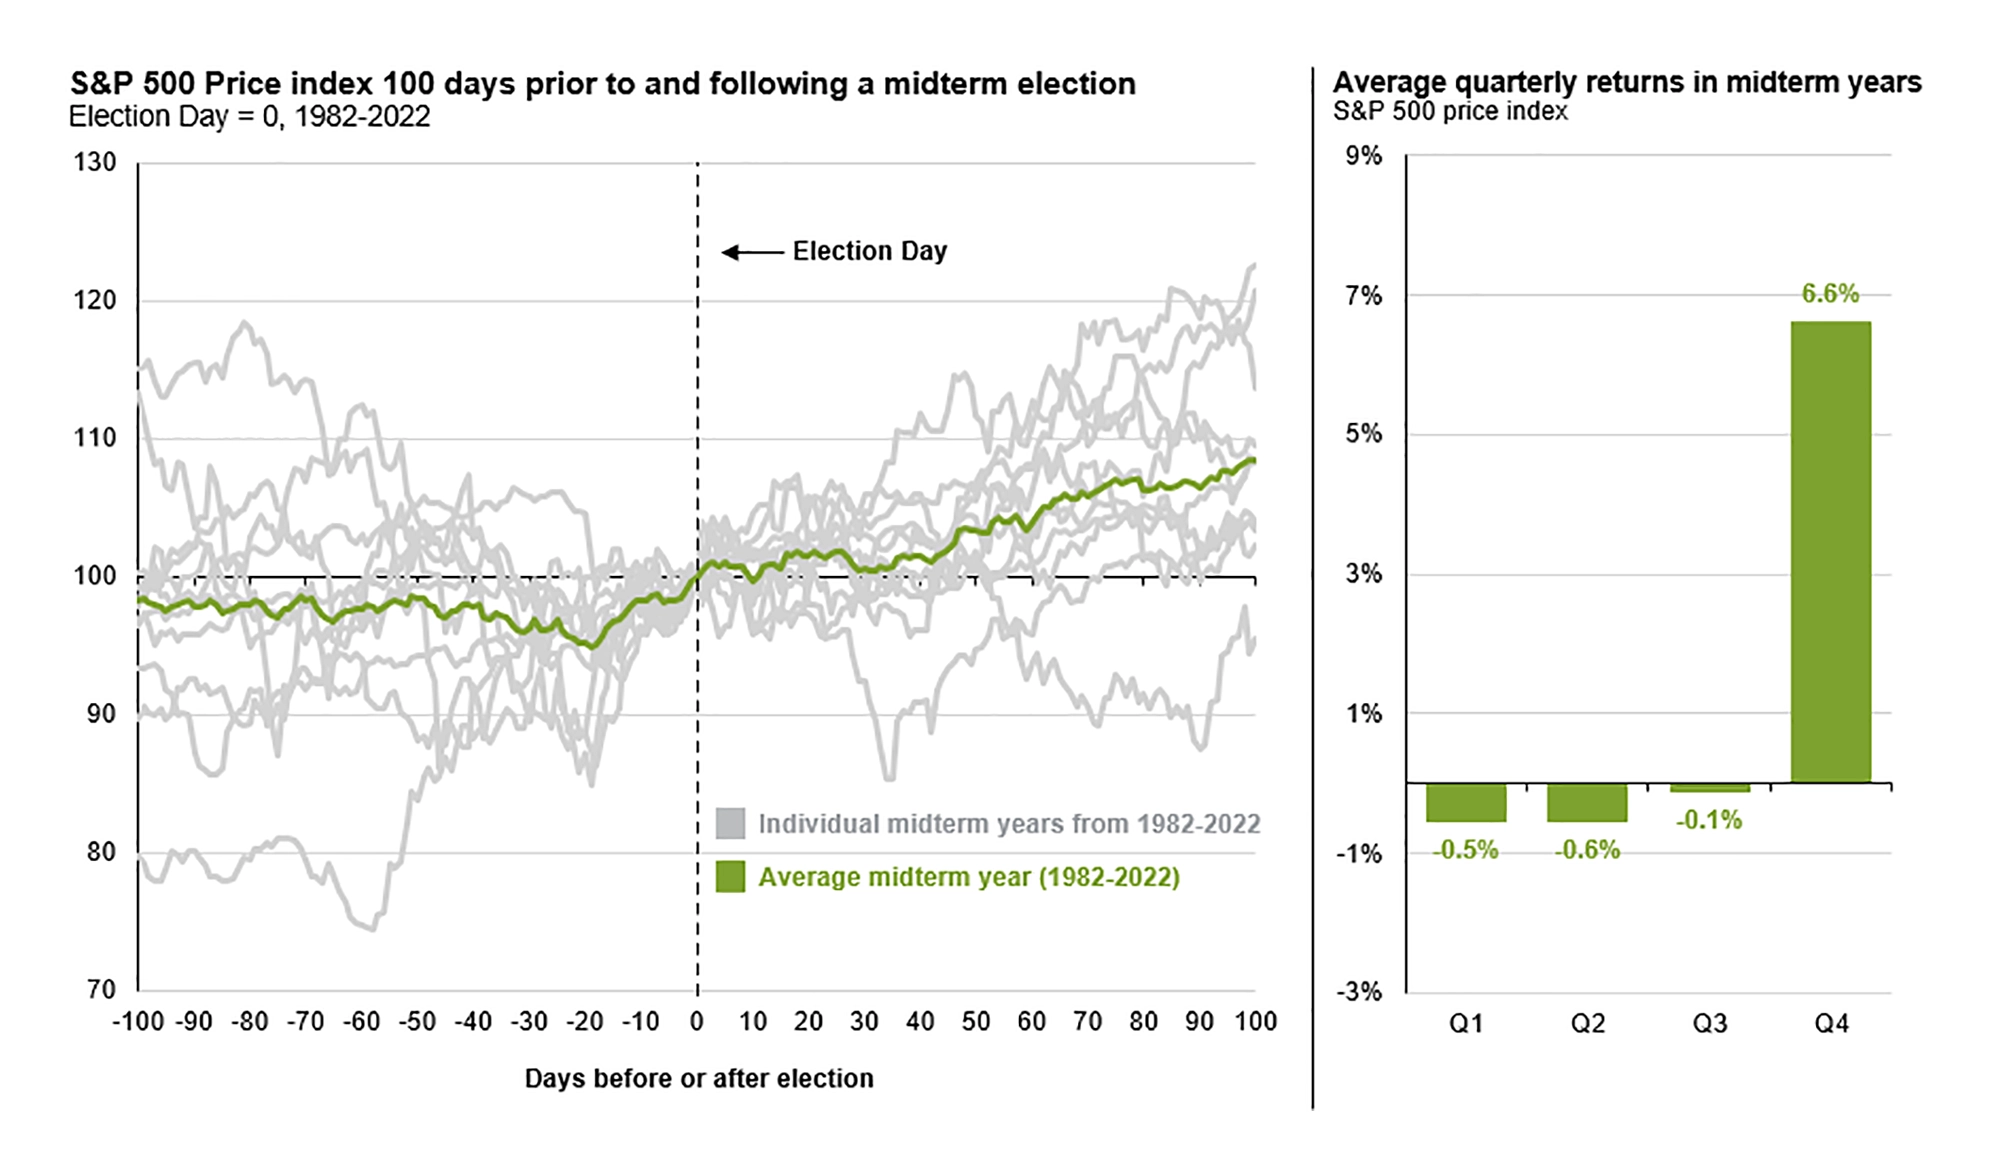
No pattern is guaranteed to repeat. In midterm elections dating back to 1982, market returns have been positive over the next 100 days (with the sole exception being the 2002 midterms which coincided with the ongoing bursting of the dot-com bubble). But as the chart below shows, underneath these averages is wide variation from one election to the next.
Figure 4: Market returns around midterm elections
Source: Standard & Poor’s, FactSet, J.P. Morgan Asset Management. Data are as of Sept. 18, 2026.
Key Takeaways
- Don’t mix politics and investing. Politics are highly emotional, and investing based on emotions is rarely a winning strategy.
- Keep in mind that the economy and markets have done well under both political parties. Even if we could accurately predict specific political outcomes, they don’t tell us anything reliable about how to invest in markets.
- Remain invested and diversified. No empirical evidence supports that either political party is better or worse for any particular sector or asset class. What has worked, and what we recommend, is remaining invested in a well-diversified portfolio.
All expressions of opinion reflect the judgment of the author as of the date of publication and are subject to change. Some of the research and ratings shown in this presentation come from third parties that are not affiliated with Mercer Advisors. The information is believed to be accurate but is not guaranteed or warranted by Mercer Advisors. Content, research, tools and stock or option symbols are for educational and illustrative purposes only and do not imply a recommendation or solicitation to buy or sell a particular security or to engage in any particular investment strategy. All investing involves risk, including the possible loss of principal. Indexes are not available for direct investment. Past performance is not a guarantee of future results
For financial planning advice specific to your circumstances, talk to a qualified professional at Mercer Advisors.
[Chartered Retirement Plan Specialist℠] and [CRPS℠] are trademarks or registered service marks of the College for Financial Planning in the United States and/or other countries.