It’s been an interesting year so far regarding market performance. Despite sticky inflation, a regional banking crisis, debt ceiling squabbles, and signs of a slowing economy, equity markets have delivered strong returns in the first four months of the year. U.S. stocks returned 8.32%, compared with 11.8% for non-U.S. developed stocks. Emerging markets came in at 2.86% for the same period.1
Equity market returns: highlights
The re-emergence of positive equity market returns has investors opening their eyes again, to sift their portfolios and ask questions about winners and losers. By and large, U.S. stocks this year have underperformed their non-U.S. developed counterparts and have outperformed emerging markets (Exhibit A). Except for emerging markets, growth has outperformed value, and large cap has outperformed small cap, through April 30.
Exhibit A: Style returns for U.S., non-U.S., and emerging markets, through April 30, 2023.
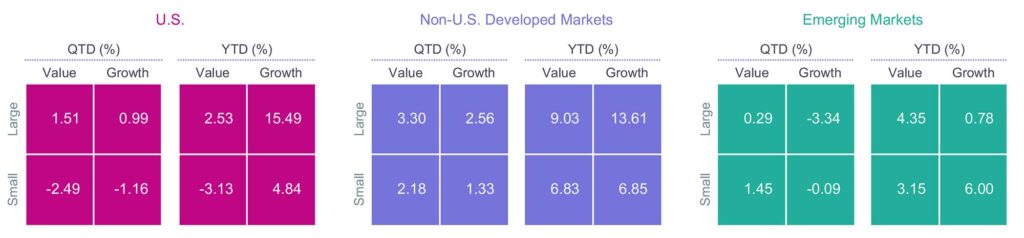
Source: Avantis Investors
What’s driving U.S. equity market returns?
Strong stock market performance so far this year raises an interesting question: With all the negative news, what’s driving U.S. equities higher? Markets certainly aren’t cheap, especially given the steep rate hikes by the Federal Reserve. A few factors can help you make sense of the positive returns:
- Narrow Advance: It’s important to first understand the data. Market indices are averages (not necessarily equally weighted but weighted nonetheless using some methodology). They consequently obfuscate important details. Consider the market-capitalization-weighted S&P 500® Index, which returned 9.18% year-to-date, through April 30.2 When we look under the hood, we see that this year’s advance has been relatively narrow, with just 10 of the 503 stocks that make up the index accounting for over 80% of its return. The index’s remaining 493 stocks collectively returned 1.95% for the year, through April 30. Why is this important? Because if you don’t own those 10 stocks—or even if you own them but not in the same weights as the index—your portfolio will behave differently from the index, perhaps significantly. Sometimes it helps returns; sometimes it hurts. More on this below.
- The Big Pause: The regional banking crisis, declining inflation, and a broadening deterioration in economic indicators suggest that the Federal Reserve may finally be finished with rate hikes. In early May, futures markets were pricing in the possibility of a rate cut as early as July. The prospect of lower interest rates bodes well for equities broadly and is an especially powerful tailwind for growthier companies whose valuations tend to be heavily dependent on distant, long-dated cash flows. Indeed, we’ve witnessed a significant change in market leadership this year: energy companies delivered strong returns in 2022, but since then technology companies have assumed the mantle of market leadership. (It’s precisely this rapid, unexpected pivot in market leadership that’s been frustrating the returns of momentum strategies.)
- Market History: Markets generally exhibit a strong tendency for recovery after a sharp decline. Since 1926, market returns have averaged 22.2% in the years following a decline of 20% or more (Exhibit B). The S&P 500 lost over 18% last year; it’s up 9.18% so far this year, through April 30.3
Exhibit B: Markets tend to do well in the years following a steep loss.
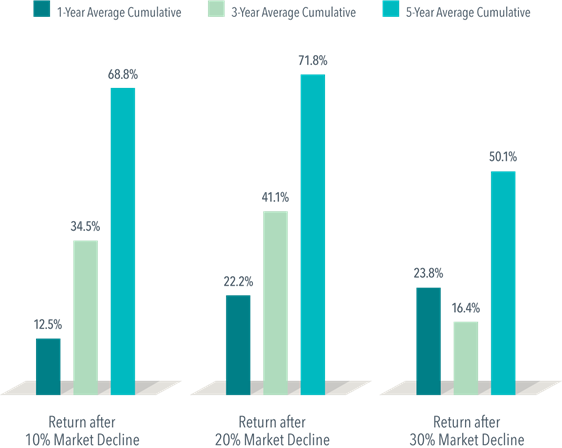
Source: Dimensional Fund Advisors
The ten darlings of the S&P 500
Here are a few more thoughts about the 10 darlings that have pushed the S&P 500 higher this year:
- Weights: The darlings make up 24.5% of the entire market capitalization of the S&P 500.4
- Returns: On an equally weighted basis, the darlings in the S&P 500 returned a whopping 41% for the year, through April 30. They lost a staggering 43% in 2022, however.
- Valuations: With an average forward price-to-earnings (P/E) ratio of 37 times forward earnings (lower is better), these are some of the growthiest (i.e., most expensive) stocks in the market.5 For context, the Russell 1000® Growth Index trades at 24 times forward earnings; the S&P 500 trades at 18 times forward earnings. Mercer Advisors’ Global Multifactor Equity Portfolio, given its value, momentum, and minimum volatility tilts, has a weighted forward P/E of 14.6 times earnings (energy’s strong returns last year helps explain why many momentum strategies also have strong value characteristics this year). Considering the steep increase in interest rates over the past year, frankly it’s surprising that valuations haven’t come down more.
Given our new world where interest rates are both (1) positive and (2) quite high, it might help to convert these forward P/E ratios to their earnings yields to provide some context for “what stocks are paying.” The earnings yield is just the inverse of the P/E ratio. Simply divide the P/E ratio into one. A forward P/E ratio of 37 equals 2.7% (1/37) average earnings yield for the darlings. For context, six-month Treasuries currently yield 5.1%.
Do we own the darlings?
Mercer Advisors’ Global Multifactor Equity Portfolio and U.S. Large Cap Multifactor Portfolio both own all ten darlings. In fact, the U.S. Large Cap Multifactor sleeve owns all of these companies in weights not that different from the S&P 500 (Exhibit C). However, any decision to diversify beyond the index—for example, to include things like small caps, non-U.S. stocks, or fixed income—means owning the darlings in weights lower than the S&P 500. Therefore, it’s not surprising when portfolios deliver returns different from those of an index of only U.S. large cap stocks.
Exhibit C: The darlings.
| Mercer Advisors Portfolio Weights |
| The Darlings of 2023 |
Index Weight |
US Large Cap Mtfcr Port. Weights |
Global Mtfcr Port. Weights |
2022 Returns |
2023 Returns |
Fwd PE |
| Apple Inc. |
6.67 |
6.46 |
3.87 |
-26.83 |
30.79 |
28.96 |
| Microsoft Corporation |
5.78 |
5.59 |
3.36 |
-28.69 |
28.44 |
31.79 |
| NVIDIA Corporation |
1.66 |
1.59 |
0.95 |
-50.31 |
89.91 |
63.80 |
| Meta Platforms Inc. Class A |
1.19 |
1.15 |
0.69 |
-64.22 |
99.70 |
20.61 |
| Amazon.com, Inc. |
2.57 |
2.46 |
1.48 |
-49.62 |
25.54 |
68.63 |
| Alphabet Inc. |
3.26 |
3.15 |
1.89 |
-38.67 |
21.66 |
20.37 |
| Tesla, Inc. |
1.38 |
1.31 |
0.79 |
-65.03 |
33.39 |
48.81 |
| Salesforce, Inc. |
0.51 |
0.49 |
0.30 |
-47.83 |
49.61 |
27.56 |
| Visa Inc. Class A |
1.08 |
1.05 |
0.63 |
-4.13 |
12.24 |
27.04 |
| Advanced Micro Devices, Inc. |
0.40 |
0.38 |
0.23 |
-54.99 |
37.98 |
32.81 |
| Average |
2.37 |
2.36 |
1.42 |
-43.03 |
41.02 |
37.04 |
Source: Factset, Inc.
Why tilt toward value when the darlings have done so well?
Past returns are material only in that they tell us something about expected returns going forward. Yet there’s no evidence that we should expect the darlings, given their high valuations, to deliver outsized returns in the future, relative to their value-stock counterparts. If prices matter and valuations are any guide, we should expect them to underperform over time.
Since 1926, value stocks have outperformed growth stocks 59% of the time, out of 1,135 overlapping, rolling one-year periods. And those odds increase with time, rising ultimately to 80% of rolling 10-year periods. Those are great odds in our business—probably the best we can expect.
Exhibit D: Value and growth stock long-term performance.
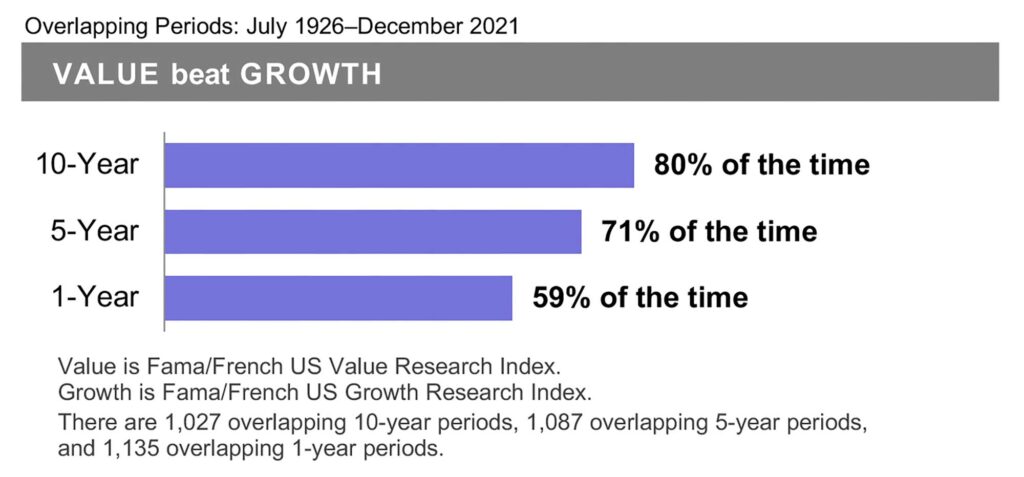
Source. Dimensional Fund Advisors
There’s certainly a chance that the darlings—and their growth stock amigos—might outperform value stocks despite their high valuations. It wouldn’t be unprecedented. Indeed, growth has beat value 41% of the time over rolling one-year periods since 1926. This has also been the case recently, with growth stocks outperforming value stocks in the past decade, which has happened about 20% of the time since 1926. If they do so in the future, the good news is that we own them. If they don’t, the good news is that we’re underweight.
Concluding thoughts
As fiduciaries, Mercer Advisors has a legal, moral, and ethical obligation to diversify client portfolios. By definition, diversification means underperforming the hottest and best-performing asset classes at any given time. That’s not an opinion; it’s a matter of simple arithmetic. It also means protecting our clients’ futures from the wealth destruction that all too often comes from concentrated portfolios, market timing, performance chasing, and expensive investment products.
Diversified portfolios may not always offer exciting outperformance; in fact, they rarely do. But what they can offer is the wisdom, reassurance, and boredom that characterizes successful, long-term investing.


Home » Insights » Market Commentary » The Darlings of 2023
The Darlings of 2023
Donald Calcagni, MBA, MST, CFP®, AIF®
Chief Investment Officer
While the stock market seems to be off to a strong start in 2023, leadership has come from a select few. See which are winning and losing.
It’s been an interesting year so far regarding market performance. Despite sticky inflation, a regional banking crisis, debt ceiling squabbles, and signs of a slowing economy, equity markets have delivered strong returns in the first four months of the year. U.S. stocks returned 8.32%, compared with 11.8% for non-U.S. developed stocks. Emerging markets came in at 2.86% for the same period.1
Equity market returns: highlights
The re-emergence of positive equity market returns has investors opening their eyes again, to sift their portfolios and ask questions about winners and losers. By and large, U.S. stocks this year have underperformed their non-U.S. developed counterparts and have outperformed emerging markets (Exhibit A). Except for emerging markets, growth has outperformed value, and large cap has outperformed small cap, through April 30.
Exhibit A: Style returns for U.S., non-U.S., and emerging markets, through April 30, 2023.
Source: Avantis Investors
What’s driving U.S. equity market returns?
Strong stock market performance so far this year raises an interesting question: With all the negative news, what’s driving U.S. equities higher? Markets certainly aren’t cheap, especially given the steep rate hikes by the Federal Reserve. A few factors can help you make sense of the positive returns:
Exhibit B: Markets tend to do well in the years following a steep loss.
Source: Dimensional Fund Advisors
The ten darlings of the S&P 500
Here are a few more thoughts about the 10 darlings that have pushed the S&P 500 higher this year:
Given our new world where interest rates are both (1) positive and (2) quite high, it might help to convert these forward P/E ratios to their earnings yields to provide some context for “what stocks are paying.” The earnings yield is just the inverse of the P/E ratio. Simply divide the P/E ratio into one. A forward P/E ratio of 37 equals 2.7% (1/37) average earnings yield for the darlings. For context, six-month Treasuries currently yield 5.1%.
Do we own the darlings?
Mercer Advisors’ Global Multifactor Equity Portfolio and U.S. Large Cap Multifactor Portfolio both own all ten darlings. In fact, the U.S. Large Cap Multifactor sleeve owns all of these companies in weights not that different from the S&P 500 (Exhibit C). However, any decision to diversify beyond the index—for example, to include things like small caps, non-U.S. stocks, or fixed income—means owning the darlings in weights lower than the S&P 500. Therefore, it’s not surprising when portfolios deliver returns different from those of an index of only U.S. large cap stocks.
Exhibit C: The darlings.
Source: Factset, Inc.
Why tilt toward value when the darlings have done so well?
Past returns are material only in that they tell us something about expected returns going forward. Yet there’s no evidence that we should expect the darlings, given their high valuations, to deliver outsized returns in the future, relative to their value-stock counterparts. If prices matter and valuations are any guide, we should expect them to underperform over time.
Since 1926, value stocks have outperformed growth stocks 59% of the time, out of 1,135 overlapping, rolling one-year periods. And those odds increase with time, rising ultimately to 80% of rolling 10-year periods. Those are great odds in our business—probably the best we can expect.
Exhibit D: Value and growth stock long-term performance.
Source. Dimensional Fund Advisors
There’s certainly a chance that the darlings—and their growth stock amigos—might outperform value stocks despite their high valuations. It wouldn’t be unprecedented. Indeed, growth has beat value 41% of the time over rolling one-year periods since 1926. This has also been the case recently, with growth stocks outperforming value stocks in the past decade, which has happened about 20% of the time since 1926. If they do so in the future, the good news is that we own them. If they don’t, the good news is that we’re underweight.
Concluding thoughts
As fiduciaries, Mercer Advisors has a legal, moral, and ethical obligation to diversify client portfolios. By definition, diversification means underperforming the hottest and best-performing asset classes at any given time. That’s not an opinion; it’s a matter of simple arithmetic. It also means protecting our clients’ futures from the wealth destruction that all too often comes from concentrated portfolios, market timing, performance chasing, and expensive investment products.
Diversified portfolios may not always offer exciting outperformance; in fact, they rarely do. But what they can offer is the wisdom, reassurance, and boredom that characterizes successful, long-term investing.
1 Ycharts, through 4/30/2023.
2 Ycharts, through 4/30/2023.
3 Ycharts, through 4/30/2023.
4 FactSet, Inc.
5 JPMorgan Guide to the Markets, April 30, 2023.
Explore More
Making a Backdoor or Mega Backdoor Roth Contribution in 2026
Why Disability Insurance Remains Essential in 2026
Q2 Market Outlook: Markets, Interest Rates, Inflation, and More
Mercer Advisors Inc. is the parent company of Mercer Global Advisors Inc. and is not involved with investment services. Mercer Global Advisors Inc. (“Mercer Advisors”) is registered as an investment advisor with the SEC. The firm only transacts business in states where it is properly registered or is excluded or exempted from registration requirements.
All expressions of opinion reflect the judgment of the author as of the date of publication and are subject to change. Some of the research and ratings shown in this presentation come from third parties that are not affiliated with Mercer Advisors. The information is believed to be accurate but is not guaranteed or warranted by Mercer Advisors. Content, research, tools and stock or option symbols are for educational and illustrative purposes only and do not imply a recommendation or solicitation to buy or sell a particular security or to engage in any particular investment strategy. For financial planning advice specific to your circumstances, talk to a qualified professional at Mercer Advisors.
Past performance may not be indicative of future results. Therefore, no current or prospective client should assume that the future performance of any specific investment, investment strategy or product made reference to directly or indirectly, will be profitable or equal to past performance levels. All investment strategies have the potential for profit or loss. Changes in investment strategies, contributions or withdrawals may materially alter the performance and results of your portfolio. Diversification and asset allocation do not ensure a profit or protect against a loss.
Different types of investments involve varying degrees of risk, and there can be no assurance that any specific investment will either be suitable or profitable for a client’s investment portfolio. Historical performance results for investment indexes and/or categories, generally do not reflect the deduction of transaction and/or custodial charges or the deduction of an investment-management fee, the incurrence of which would have the effect of decreasing historical performance results. Economic factors, market conditions, and investment strategies will affect the performance of any portfolio and there are no assurances that it will match or outperform any particular benchmark.
This document may contain forward-looking statements including statements regarding our intent, belief or current expectations with respect to market conditions. Readers are cautioned not to place undue reliance on these forward-looking statements. While due care has been used in the preparation of forecast information, actual results may vary in a materially positive or negative manner. Forecasts and hypothetical examples are subject to uncertainty and contingencies outside Mercer Advisors’ control.
Certified Financial Planner Board of Standards, Inc. (CFP Board) owns the CFP® certification mark, the CERTIFIED FINANCIAL PLANNER® certification mark, and the CFP® certification mark (with plaque design) logo in the United States, which it authorizes use of by individuals who successfully complete CFP Board’s initial and ongoing certification requirements.