
Although 2024 has only just begun, the November elections are already occupying the attention of media and investors alike. In addition to choosing the next president, voters will fill 34 Senate seats, all 435 seats in the House of Representatives, and 11 governorships. With so much to be decided, a strong sense of unease is understandable.
In fact, a recent sentiment survey found that the U.S. presidential election is what investors are most concerned about, with 61% worried it will negatively impact their investment performance.1 Issues such as war in the Middle East, a potential recession, high inflation, high interest rates, and U.S./China relations all ranked lower in the list. Another survey found that 45% of investors expect the federal election to have a bigger impact on their portfolio than market performance itself, with 32% also believing an economic recession will occur within 12 months if the party they oppose gains more power.2
Although reasonable investors are feeling anxious or fearful about the November election, decades of market data show that those who remain steadfast will most likely be rewarded. Investors should continue to dutifully review their financial plan with a trusted advisor, and boldly guard against making investment decisions based on the upcoming election. Our advice to investors amid the uncertainty? Don’t peg a portfolio to politics.
Equity Market Returns in Election Years
A common misconception is that U.S. equity markets suffer during a presidential election year. But history shows us that neither an election nor the party elected has a material impact on markets. Since 1928, the S&P 500® Index has posted a positive total return in 20 of 24 election years, and these gains have been more common than in non-election years.3 The rate of positive return during election years would have been even higher if not for declines in 2000 and 2008, when the index delivered total returns of –9.1% and –37.0%, respectively. You’ll recall that investors had much more on their minds than a presidential election, specifically the dot-com bubble bursting (2000) and the global financial crisis (2008). What’s true for all election years, however, is that many distinct yet interconnected factors will ultimately determine market performance, including this year.
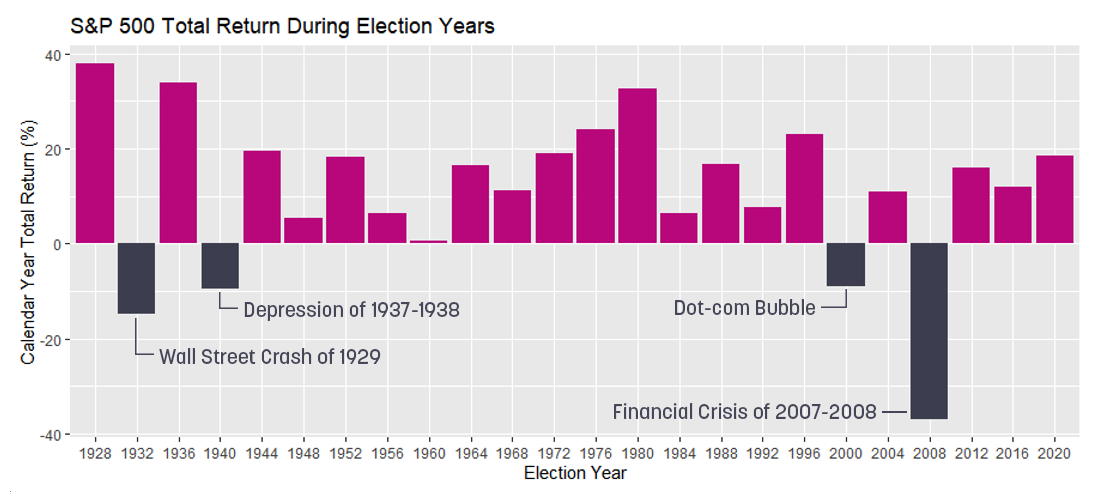
Past performance may not be indicative of future results. Indexes are not available for direct investment.
While the frequency of years with a positive return is important, measuring average return over time also helps in understanding the investor experience. Since 1930, average return of the S&P 500 during the 12 months leading up to Election Day was 7.2%, and it was 9.0% during the same 12 months in non-election years.4 Although the election-year average is lower, it doesn’t prove that U.S. equity markets underperform during those years. In fact, a statistical analysis found that the difference between the two averages is insignificant and may simply be due to chance.5
Even close elections, which presumably generate more uncertainty than one-sided elections, have not had a clear impact on market returns. When measuring the competitiveness of an election by the ultimate margin of victory in the popular and electoral vote counts, no meaningful difference was found in previous returns leading up to close races versus those leading up to one-sided races.
Market Volatility During Election Years
Although decades of market data show no meaningful difference between returns in election and non-election years, is it possible there’s a difference in risk? Again, history suggests the answer is no.
Risk can be measured in many ways, and probability of not meeting long-term financial goals is likely the most important one for investors. Lacking inclusion of an individual’s financial plan, volatility of returns is another useful measure of risk. Research by Vanguard found that between 1984 and 2020, annualized volatility of the S&P 500 in the 100 days before an election was 16.5%, and annualized volatility of the index during the entire 36-year period was 17.9%.6 This suggests that equity markets are slightly less risky leading up to an election.7
Another useful measure of market risk is the CBOE Volatility Index, or VIX. It measures how much volatility professional investors think the S&P 500 Index will experience over the next 30 days and is typically used to gauge market sentiment. VIX tends to rise when investors are more uncertain and fearful about the future.
As the left panel of the chart below shows, since 1990 the average level of market risk (VIX) has increased sharply during the 100 days before an election. When 2008 is excluded, as shown in the right panel below, the relationship between market risk and Election Day is much less pronounced. In the 100 days leading up to the 2008 election, Lehman Brothers and Washington Mutual declared bankruptcy, the short-term corporate lending market froze, and the S&P 500 tumbled by more than 30%. It’s therefore presumed that the rise in VIX was more reflective of the global financial crisis than it was of the upcoming election.
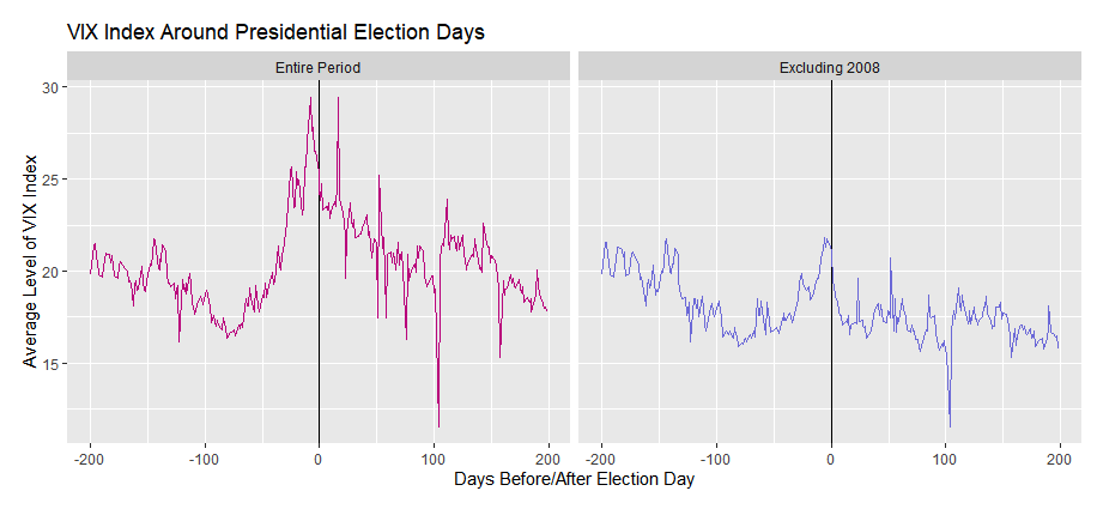
Past performance may not be indicative of future results. Indexes are not available for direct investment.
Even with 2008 excluded, this analysis shows that market risk has increased slightly in the days preceding an election, to a level just above the long-term average. Moreover, it quickly returned to normal levels once the election, and uncertainty about the outcome, are in the rearview mirror.
Time in the Market Beats Trying to Time the Market
Despite evidence that equity-market risks and returns are not materially different in an election year, some investors may still be tempted to make portfolio changes. A belief that “this time is different” is hard to negotiate. But we do know that attempts to time the market rarely pay off. For instance, the value of $100,000 invested in a 60/40 portfolio rebalanced annually over the past 35 years would’ve increased to $2,020,953.8 But a portfolio invested with the same allocation during only non-election years would’ve increased to just $1,384,423. Sitting on the sidelines because you’re trying to time the market deprives a portfolio of the benefit of compounded returns.
As we advised after the 2022 midterm election, an investor’s political concerns should not drive their investment decision-making. Elections have not been particularly relevant to investment risks and returns in the past, and there’s no reason to believe this year’s election will be any different. Our advice is for investors to focus on their long-term financial plan, review it often with a trusted advisor, and remain steadfast in not making investment decisions based on the election ahead.
1 Buchanan, Naomi. “Investors’ Election Year Worries Could Be Overblown, Experts Say.” Investopedia, 31 December 2023.
2 “Nearly Half of Investors Believe the 2024 Election Will Have a Bigger Impact on Portfolios Than Market Performance.” Nationwide Mutual Insurance, 30 October 2023.
3 Since 1928, the S&P 500 has posted a positive total return in 51 of the 72 years when a presidential election was not held, or 71%.
4 To calculate these comparable periods for non-election years, we determined when an election would have occurred—that is, the Tuesday that follows the first Monday of November for that year.
5 “A Refresher on Statistical Significance.” Harvard Business Review, 12 October 2022.
6 “Presidential Elections Matter but Not so Much When It Comes to Your Investments.” Vanguard, 26 October 2023.
7 Research also showed that annualized volatility in the 100 days following an election was just 15.9%. This may indicate relief in moving past the uncertainty of the election.
8 Calculated using the calendar-year total return of the S&P 500 and the Bloomberg US Aggregate Bond Index rebalanced annually.