Tuesday’s CPI report for January came in hotter-than-hoped. While headline CPI fell -0.1% in December (0.3% for core), prices rose 0.5% in January (0.40% for core).
Time Out: Let’s step back and look at the big picture
There are a few immediate takeaways from Tuesday’s CPI report that bear mentioning.
First, it’s unrealistic to expect inflation to come down in a straight-line month-over-month. That’s not how monetary policy works. The economy is infinitely complex and economic data can be both messy (hard to measure) and noisy (highly volatile from month to month). It’s far better to look at data over time (to identity broad trends) than to fixate on any single data point in isolation.
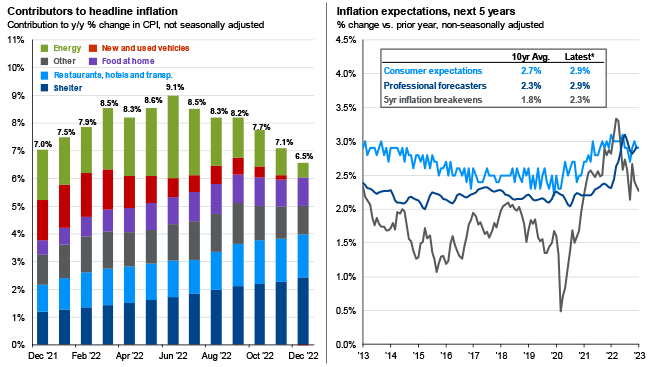
Second, when we step back and take a broader view of CPI data over time, it’s clear that inflation is coming down. Even when we take into account this morning’s higher than expected CPI data, inflation is obviously trending down. On a year-over-year basis, headline inflation fell from 6.5% in December to 6.4% in January; core inflation (ex-food and energy) fell in January to 5.6% (down from 5.7% in December). While these declines are due to base effects (i.e., the drop off in earlier months with higher inflation), there is no ignoring the trend (see below bar chart through December 2022).
Exhibit A: Inflation Drivers and Expectations.

(Source: JPM Guide to the Market, Slide 30). Values may not sum to headline CPI figures due to rounding and underlying calculations. “Shelter” includes owner’s equivalent rent and rent of primary residence. “Other” primarily reflects household furnishings, apparel, education and communication services, medical care services and other personal services. *Reflects the latest daily 5yr/5yr breakevens, preliminary or final Consumer Sentiment survey, and the quarterly Survey of Professional Forecasters interpolated to a monthly series. The Survey of Professional Forecasters reflects the median estimate by professional forecasters of average CPI inflation over the next 5 years. The series has been adjusted by J.P. Morgan Asset Management to exclude realized inflation readings within the forecast window. Guide to the Markets – U.S. Data are as of January 31, 2023.
Third, while rate hikes are almost immediately reflected in financial markets, it’s estimated that they take much longer to work their way through the real economy—potentially as long as 12 months. It’s therefore likely that the steep rate hikes of the past 11 months have yet to be fully reflected in consumer prices. It’s for this reason that economists forecast that inflation will likely fall to 3% by year-end and will likely come back in line with the Fed’s longer term 2 – 2.5% inflation target over the next few years.
Finally, the economy is slowing. Consumer debt is mounting, savings rates are declining, new housing starts are down, and growing inventories all point to slowing GDP growth in the year ahead. Q4 GDP growth, adjusted for inventories, grew at 1.4%. While forecasting the future path of the economy is always challenging, a growing body of evidence suggests GDP growth will likely continue to slow in 2023 (and may even go negative).
Investment implications
Tuesday’s CPI news has several implications for investors.
Patience is a virtue.
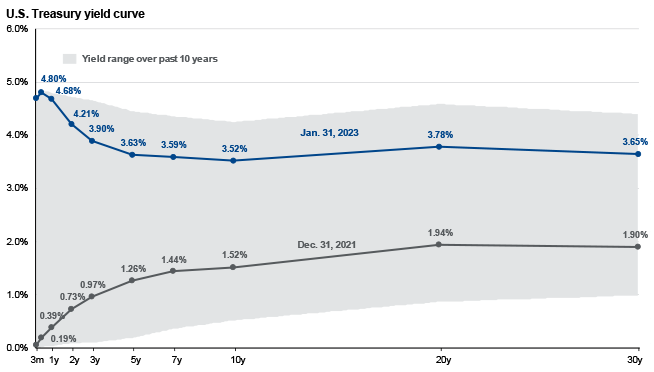
Despite strong returns in longer duration fixed income in January, it’s probably too soon to add duration back to fixed income portfolios. For starters, there is no obvious reward for doing so—the yield curve is still steeply inverted around the 6-month mark. It doesn’t make sense to extend duration until the curve normalizes (remember, our investment philosophy is predicated on responding to market prices, not forecasting them). Further, the curve’s inversion may get worse before it gets better. The Fed has consistently communicated that they intend to continue raising rates until they’re certain inflation is under control. While investors may agree or disagree with Fed policy, we’d be well advised to take the Fed at its word.
Exhibit B: US Treasury Curves for February 13, 2023 and December 31, 2021.

(Source: JPM Guide to the Market, Slide 38). U.S. Data are as of January 31, 2023.
Don’t over think equities.
Equities are long-term investments and investors should resist making big changes to their equity allocations in response to economic data. But that doesn’t mean there aren’t opportunities for pruning. For example, the January rally in growth stocks was probably a bit premature, as markets had erroneously expected the Fed would pause by now. Tuesday’s CPI print makes future rate hikes more likely, not less. And future rate hikes will only put downward pressure on growth stocks’ long dated future cash flows (remember, stock prices are the present value of future expected cash flows [profits], discounted back to the present by a market determined discount rate). With a forward PE of 23.5x (an earnings yield of only 4.25%, less than what’s available on 6-month treasuries), growth stocks are far from cheap, especially relative to fixed income yields. For context, value stocks are trading at 14.9x next year’s earnings, an earnings yield of about 6.7%. The takeaway is that investors would be wise to consider trimming growth and overweighting value.
Look beyond the U.S.
The investment case for owning non-U.S. stocks is predicated on valuations, the strong U.S. dollar, and the diversification benefits they typically provide U.S.-centric portfolios.
- On valuations, non-U.S. developed market stocks trade at 13x earnings (an earnings yield of 7.7%) and emerging market stocks trade at 12.5x earnings (an earnings yield of 8%). Why is this important? Because investors shouldn’t care where their profits come from. A dollar of earnings is the same regardless of the sector, country, or asset class where it was earned. The only thing that differs is what we pay (in the form of stock prices) to lay claim to that dollar.
- On the U.S. dollar, it’s down about 10% since September. If the Fed pauses on rates while other central banks continue to raise, that should put downward pressure on the U.S. dollar and boost the values of non-U.S. stocks for U.S.-based investors.
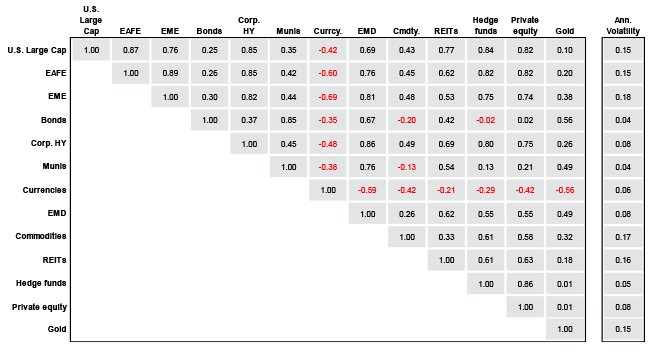
- On diversification, non-U.S. stocks typically provide hard-to-find diversification benefits to U.S. stocks. With correlations of 0.87 for non-U.S. developed market stocks and 0.76 for emerging market stocks, adding non-U.S. stocks to our portfolios can help diversify our portfolios sources of returns and cushion against declines or softer returns in other markets. For example, despite the ongoing war in Ukraine and doomsday predictions for the European economy, European stocks are up a handsome 9.9% versus 7.9% for U.S. stocks (yet more evidence for why investors should be wary of economic forecasts).
Exhibit C: Correlation matrix for popular asset classes.

(Source: JPM Guide to the Market, slide 56). Large Cap: S&P 500 Index; Currencies: Federal Reserve Trade-Weighted Dollar; EAFE: MSCI EAFE; EME: MSCI Emerging Markets; Bonds: Bloomberg Aggregate; Corp HY: Bloomberg Corporate High Yield; EMD: Bloomberg Emerging Market; Cmdty.: Bloomberg Commodity Index; REITs: NAREIT All Equity Index; Hedge funds: CS/Tremont Hedge Fund Index; Private equity: Time weighted returns from Burgiss; Gold: Gold continuous contract ($/oz). Private equity data are reported on a one- to two-quarter lag. All correlation coefficients and annualized volatility are calculated based on quarterly total return data for period from 12/31/2012 to 12/31/2022, except for Private equity, which is based on the period from 6/30/2012 to 6/30/2022. This chart is for illustrative purposes only. Guide to the Markets – U.S. Data are as of January 31, 2023.


Home » Insights » Market Commentary » What’s Going on with CPI?
What’s Going on with CPI?
Donald Calcagni, MBA, MST, CFP®, AIF®
Chief Investment Officer
Tuesday’s CPI report for January came in hotter-than-hoped. Should this be a surprise, or will it take longer to bring inflation down?
Tuesday’s CPI report for January came in hotter-than-hoped. While headline CPI fell -0.1% in December (0.3% for core), prices rose 0.5% in January (0.40% for core).
Time Out: Let’s step back and look at the big picture
There are a few immediate takeaways from Tuesday’s CPI report that bear mentioning.
First, it’s unrealistic to expect inflation to come down in a straight-line month-over-month. That’s not how monetary policy works. The economy is infinitely complex and economic data can be both messy (hard to measure) and noisy (highly volatile from month to month). It’s far better to look at data over time (to identity broad trends) than to fixate on any single data point in isolation.
Second, when we step back and take a broader view of CPI data over time, it’s clear that inflation is coming down. Even when we take into account this morning’s higher than expected CPI data, inflation is obviously trending down. On a year-over-year basis, headline inflation fell from 6.5% in December to 6.4% in January; core inflation (ex-food and energy) fell in January to 5.6% (down from 5.7% in December). While these declines are due to base effects (i.e., the drop off in earlier months with higher inflation), there is no ignoring the trend (see below bar chart through December 2022).
Exhibit A: Inflation Drivers and Expectations.
(Source: JPM Guide to the Market, Slide 30). Values may not sum to headline CPI figures due to rounding and underlying calculations. “Shelter” includes owner’s equivalent rent and rent of primary residence. “Other” primarily reflects household furnishings, apparel, education and communication services, medical care services and other personal services. *Reflects the latest daily 5yr/5yr breakevens, preliminary or final Consumer Sentiment survey, and the quarterly Survey of Professional Forecasters interpolated to a monthly series. The Survey of Professional Forecasters reflects the median estimate by professional forecasters of average CPI inflation over the next 5 years. The series has been adjusted by J.P. Morgan Asset Management to exclude realized inflation readings within the forecast window. Guide to the Markets – U.S. Data are as of January 31, 2023.
Third, while rate hikes are almost immediately reflected in financial markets, it’s estimated that they take much longer to work their way through the real economy—potentially as long as 12 months. It’s therefore likely that the steep rate hikes of the past 11 months have yet to be fully reflected in consumer prices. It’s for this reason that economists forecast that inflation will likely fall to 3% by year-end and will likely come back in line with the Fed’s longer term 2 – 2.5% inflation target over the next few years.
Finally, the economy is slowing. Consumer debt is mounting, savings rates are declining, new housing starts are down, and growing inventories all point to slowing GDP growth in the year ahead. Q4 GDP growth, adjusted for inventories, grew at 1.4%. While forecasting the future path of the economy is always challenging, a growing body of evidence suggests GDP growth will likely continue to slow in 2023 (and may even go negative).
Investment implications
Tuesday’s CPI news has several implications for investors.
Patience is a virtue.
Despite strong returns in longer duration fixed income in January, it’s probably too soon to add duration back to fixed income portfolios. For starters, there is no obvious reward for doing so—the yield curve is still steeply inverted around the 6-month mark. It doesn’t make sense to extend duration until the curve normalizes (remember, our investment philosophy is predicated on responding to market prices, not forecasting them). Further, the curve’s inversion may get worse before it gets better. The Fed has consistently communicated that they intend to continue raising rates until they’re certain inflation is under control. While investors may agree or disagree with Fed policy, we’d be well advised to take the Fed at its word.
Exhibit B: US Treasury Curves for February 13, 2023 and December 31, 2021.
(Source: JPM Guide to the Market, Slide 38). U.S. Data are as of January 31, 2023.
Don’t over think equities.
Equities are long-term investments and investors should resist making big changes to their equity allocations in response to economic data. But that doesn’t mean there aren’t opportunities for pruning. For example, the January rally in growth stocks was probably a bit premature, as markets had erroneously expected the Fed would pause by now. Tuesday’s CPI print makes future rate hikes more likely, not less. And future rate hikes will only put downward pressure on growth stocks’ long dated future cash flows (remember, stock prices are the present value of future expected cash flows [profits], discounted back to the present by a market determined discount rate). With a forward PE of 23.5x (an earnings yield of only 4.25%, less than what’s available on 6-month treasuries), growth stocks are far from cheap, especially relative to fixed income yields. For context, value stocks are trading at 14.9x next year’s earnings, an earnings yield of about 6.7%. The takeaway is that investors would be wise to consider trimming growth and overweighting value.
Look beyond the U.S.
The investment case for owning non-U.S. stocks is predicated on valuations, the strong U.S. dollar, and the diversification benefits they typically provide U.S.-centric portfolios.
Exhibit C: Correlation matrix for popular asset classes.
(Source: JPM Guide to the Market, slide 56). Large Cap: S&P 500 Index; Currencies: Federal Reserve Trade-Weighted Dollar; EAFE: MSCI EAFE; EME: MSCI Emerging Markets; Bonds: Bloomberg Aggregate; Corp HY: Bloomberg Corporate High Yield; EMD: Bloomberg Emerging Market; Cmdty.: Bloomberg Commodity Index; REITs: NAREIT All Equity Index; Hedge funds: CS/Tremont Hedge Fund Index; Private equity: Time weighted returns from Burgiss; Gold: Gold continuous contract ($/oz). Private equity data are reported on a one- to two-quarter lag. All correlation coefficients and annualized volatility are calculated based on quarterly total return data for period from 12/31/2012 to 12/31/2022, except for Private equity, which is based on the period from 6/30/2012 to 6/30/2022. This chart is for illustrative purposes only. Guide to the Markets – U.S. Data are as of January 31, 2023.
Explore More
The Downgrade of U.S. Government Debt: Insights From Our CIO
Q2 Market Outlook: What Does Q2 Hold for Investors?
After the Fall: Four Questions for Investors: Insights From Our CIO
Mercer Advisors Inc. is the parent company of Mercer Global Advisors Inc. and is not involved with investment services. Mercer Global Advisors Inc. (“Mercer Advisors”) is registered as an investment advisor with the SEC. The firm only transacts business in states where it is properly registered or is excluded or exempted from registration requirements.
All expressions of opinion reflect the judgment of the author as of the date of publication and are subject to change. Some of the research and ratings shown in this presentation come from third parties that are not affiliated with Mercer Advisors. The information is believed to be accurate but is not guaranteed or warranted by Mercer Advisors. Content, research, tools and stock or option symbols are for educational and illustrative purposes only and do not imply a recommendation or solicitation to buy or sell a particular security or to engage in any particular investment strategy. For financial planning advice specific to your circumstances, talk to a qualified professional at Mercer Advisors.
Past performance may not be indicative of future results. Therefore, no current or prospective client should assume that the future performance of any specific investment, investment strategy or product made reference to directly or indirectly, will be profitable or equal to past performance levels. All investment strategies have the potential for profit or loss. Changes in investment strategies, contributions or withdrawals may materially alter the performance and results of your portfolio. Different types of investments involve varying degrees of risk, and there can be no assurance that any specific investment will either be suitable or profitable for a client’s investment portfolio. Diversification and asset allocation do not ensure a profit or protect against a loss. Historical performance results for investment indexes and/or categories, generally do not reflect the deduction of transaction and/or custodial charges or the deduction of an investment-management fee, the incurrence of which would have the effect of decreasing historical performance results. Economic factors, market conditions, and investment strategies will affect the performance of any portfolio and there are no assurances that it will match or outperform any particular benchmark.
This document may contain forward-looking statements including statements regarding our intent, belief or current expectations with respect to market conditions. Readers are cautioned not to place undue reliance on these forward-looking statements. While due care has been used in the preparation of forecast information, actual results may vary in a materially positive or negative manner. Forecasts and hypothetical examples are subject to uncertainty and contingencies outside Mercer Advisors’ control.
Mercer Advisors is not a law firm and does not provide legal advice to clients. All estate planning document preparation and other legal advice are provided through Advanced Services Law Group, Inc.