In early May, the ratings agency Moody’s downgraded the credit rating of the U.S., pointing to the government’s growing debt burden in a higher-interest rate environment and the lack of political progress towards lowering deficits.
Below we explore some of the more common questions around U.S. government debt and try to put this downgrade in context.
What do these ratings mean?
The U.S. has three major credit rating agencies: S&P, Fitch and Moody’s. These agencies provide evaluate the creditworthiness of major corporate and government borrowers. This rating is used by investors to assess the relative credit risks inherent in the debt (bonds) that they issue to investors.
Bonds are given a rating ranging from AAA to “junk.” AAA, which is a high rating indicating strong creditworthiness and a low risk of default. . Although all three agencies use AAA to indicate the best bonds, they use a different ratings scale to denote declines in the credit worthiness of borrowers. Moody’s just downgraded the U.S. to its second-best credit rating of Aa1. There are 10 different credit ratings that are considered “investment grade”, and the U.S. still has the second-best rating of those 10.
How does the U.S. compare?
Although the U.S. still has a relatively good rating, it’s no longer best-in-class, which may be somewhat surprising for the country with the world’s largest economy. Several other countries still have top credit ratings, including Australia, Germany, Singapore, Sweden, and Switzerland. Just two companies, Microsoft and Johnson & Johnson, also have the top credit rating of AAA.
Per the chart below, only three advanced economies, Japan, Greece, and Italy, have a higher debt burden than the U.S. when expressed as a share of their economy (the debt-to-GDP ratio).
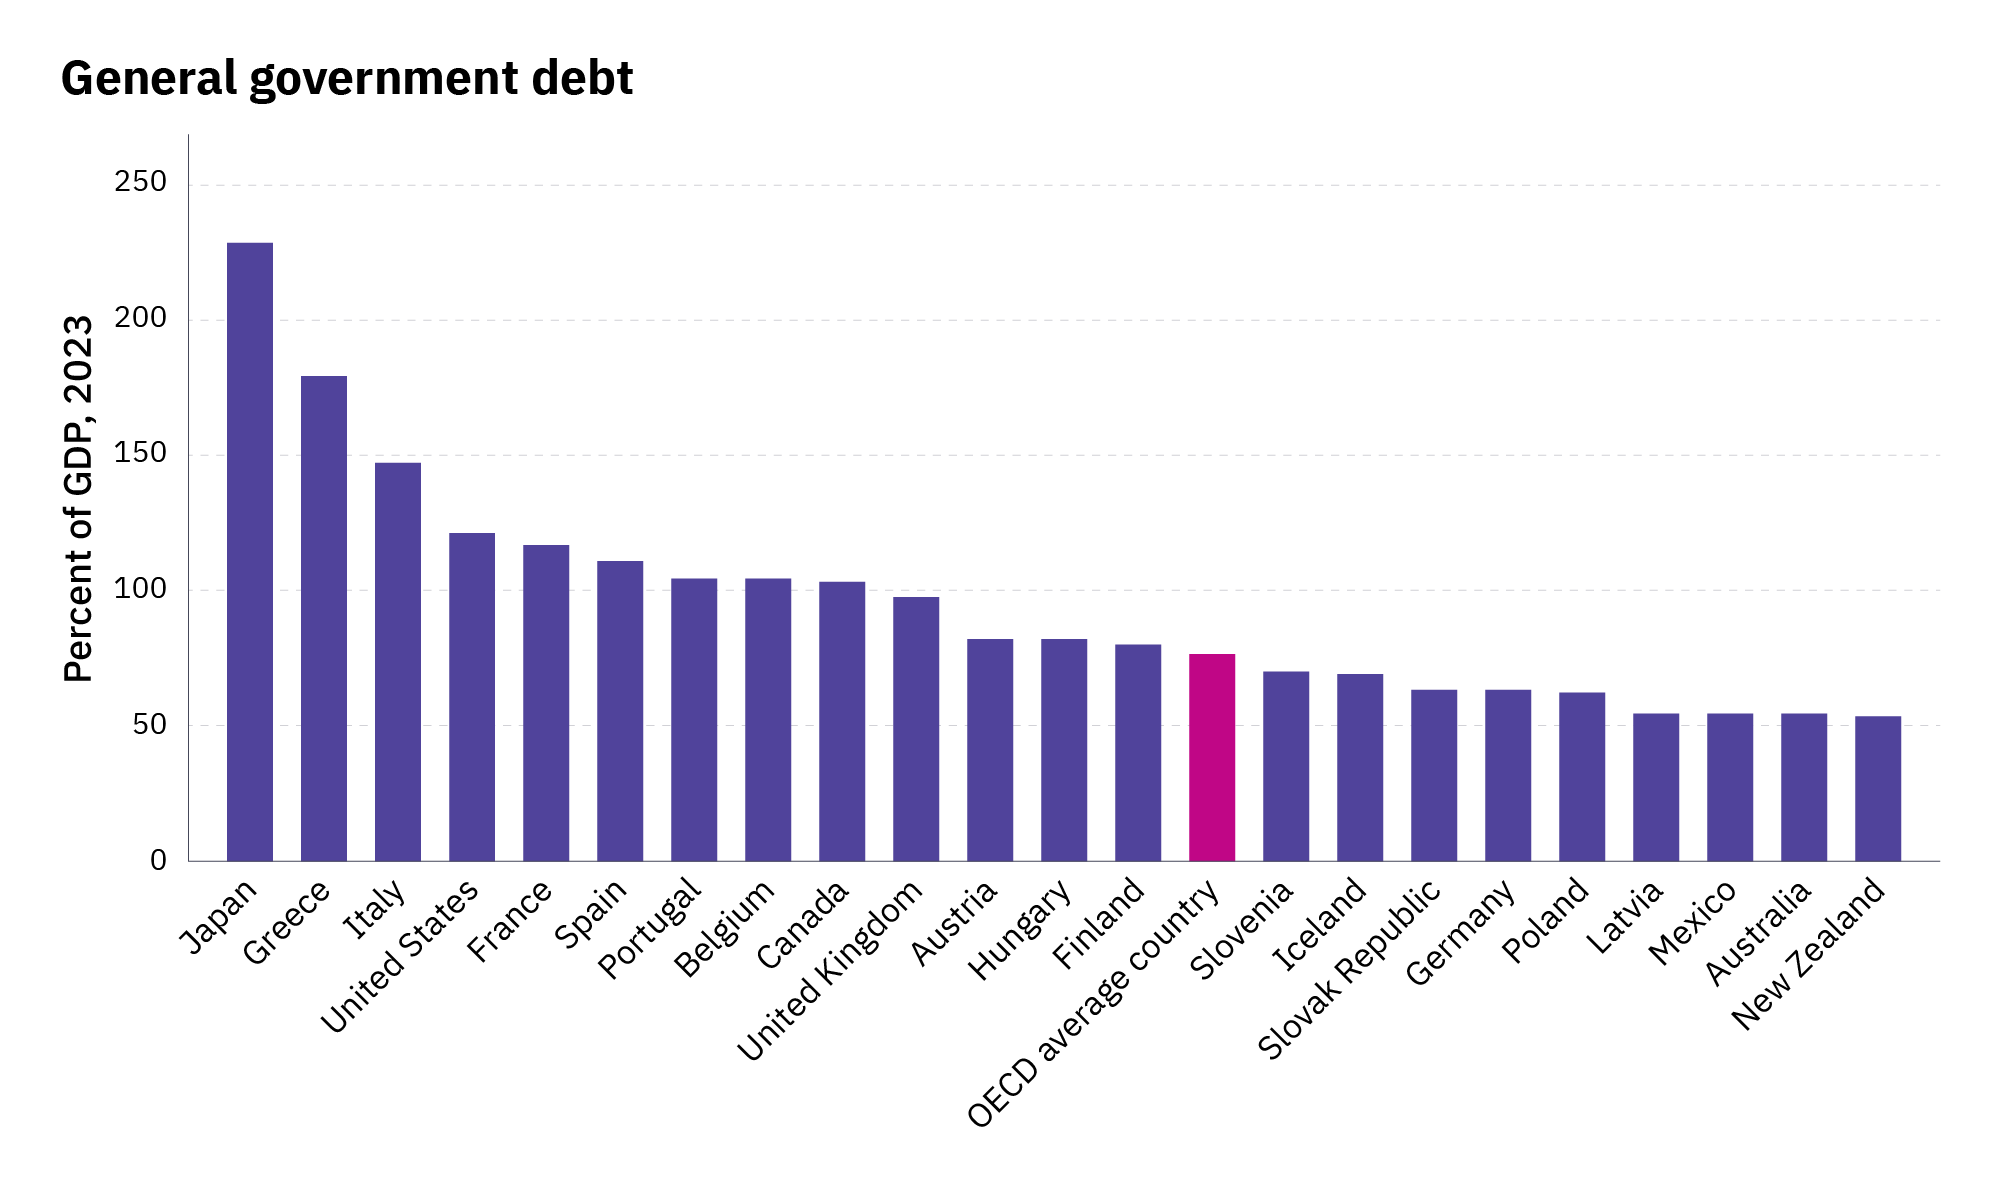
Source: Organisation for Economic Co-operation and Development (OECD). General government debt is the gross debt of the general government as a percentage of GDP.
Hasn’t this downgrade happened before?
Yes, the downgrade has happened before…but not from Moody’s. The U.S. was downgraded by Standard & Poor’s in August 2011, during a showdown between Congress and the White House over the debt ceiling.
In 2023, the ratings agency Fitch followed suit, citing “a high and growing general government debt burden, and the erosion of governance” by which Fitch meant a political environment in which Congress and the White House were having repeated political standoffs that frequently included threats to default on U.S. Treasury obligations.
In announcing its downgrade of U.S. government debt this past week, Moody’s joins the other two agencies in their assessment. The stock market had little reaction to the downgrade since, when it comes to evaluating the stability of U.S. debt, the market arguably already knows everything about the U.S. creditworthiness that Moody’s factored into its analysis. Markets are typically much quicker than ratings agencies when it comes to assessing and pricing risks.
How dire is the U.S. debt outlook?
The federal government has not generated a surplus since 1998-2001. For nearly a quarter century U.S. federal government debt has accumulated year-after-year, regardless of who occupied the White House or which party-controlled Congress.
We frequently remind investors that politics and investing don’t mix, and the growth in U.S. government debt and deficits is yet another example of why. While we may like to think that our preferred political party can easily resolve these issues if they fully controlled Congress and the White House, the fact remains that deficit reduction has remained elusive for both parties across many decades.
Currently, deficits and debt are both large and projected to grow. Now, Congress is considering an extension of the TCJA tax cuts which were implemented in 2018. The Congressional Budget Office projects that an extension of these cuts – which means a reduction in government revenues – would contribute to further increases in annual deficits and in the total amount of government debt outstanding (see charts below).
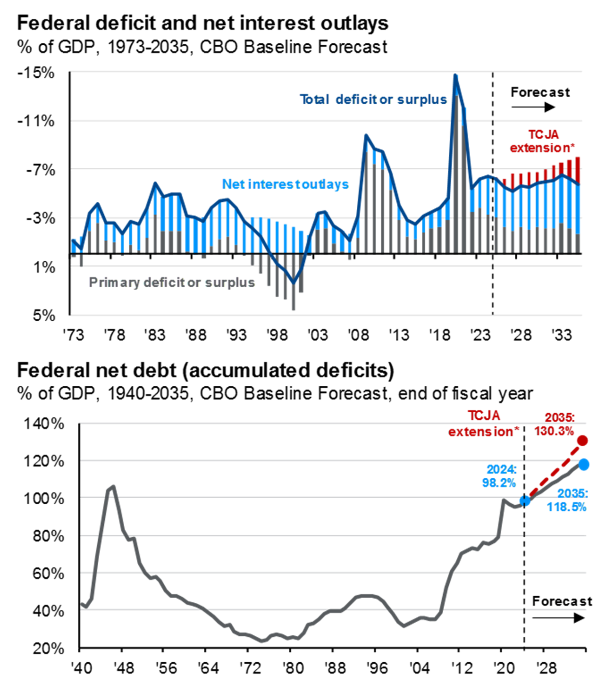
Source: Congressional Budget Office, J.P. Morgan Asset Management, BEA, Treasury Department. Estimates are from the Congressional Budget Office (CBO) January 2025 An Update to the Budget Outlook: 2025 to 2035.
The deficit for fiscal year 2025 is projected to be larger than all non-defense discretionary spending from the federal government (see below). This is among the reasons why many budget analysts have long argued that closing the deficit will certainly require a painful combination of both higher taxes and lower spending (which invariably will likely require some combination of cuts to entitlements and defense spending, both of which are highly cherished programs).
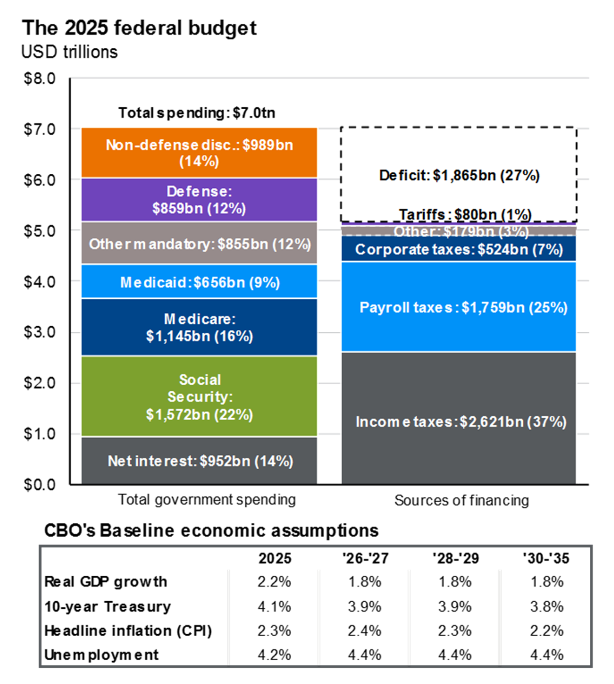
Source: Congressional Budget Office, J.P. Morgan Asset Management; Numbers may not sum to 100% due to rounding.
Exacerbating our nation’s debt burden is the growing interest expense on outstanding obligations. The U.S. government’s debt outstanding, about $36 trillion is the sum total of all prior deficits incurred by the U.S. government. The interest expense on this debt has grown significantly the past few years as interest rates increased. As older Treasury debt matures (bonds that were issued when interest rates were lower) the U.S. treasury is forced to refinance that debt at today’s interest rates. From 2008 until 2022, the U.S. government benefited from an exceptionally low interest rate environment. Those days are gone.
Who owns our debt?
To understand the scale of our national debt, consider these numbers. The total U.S. debt is about $36 trillion. U.S. gross domestic product is about $30 trillion per year. U.S. households have approximately $169 trillion in total net worth.
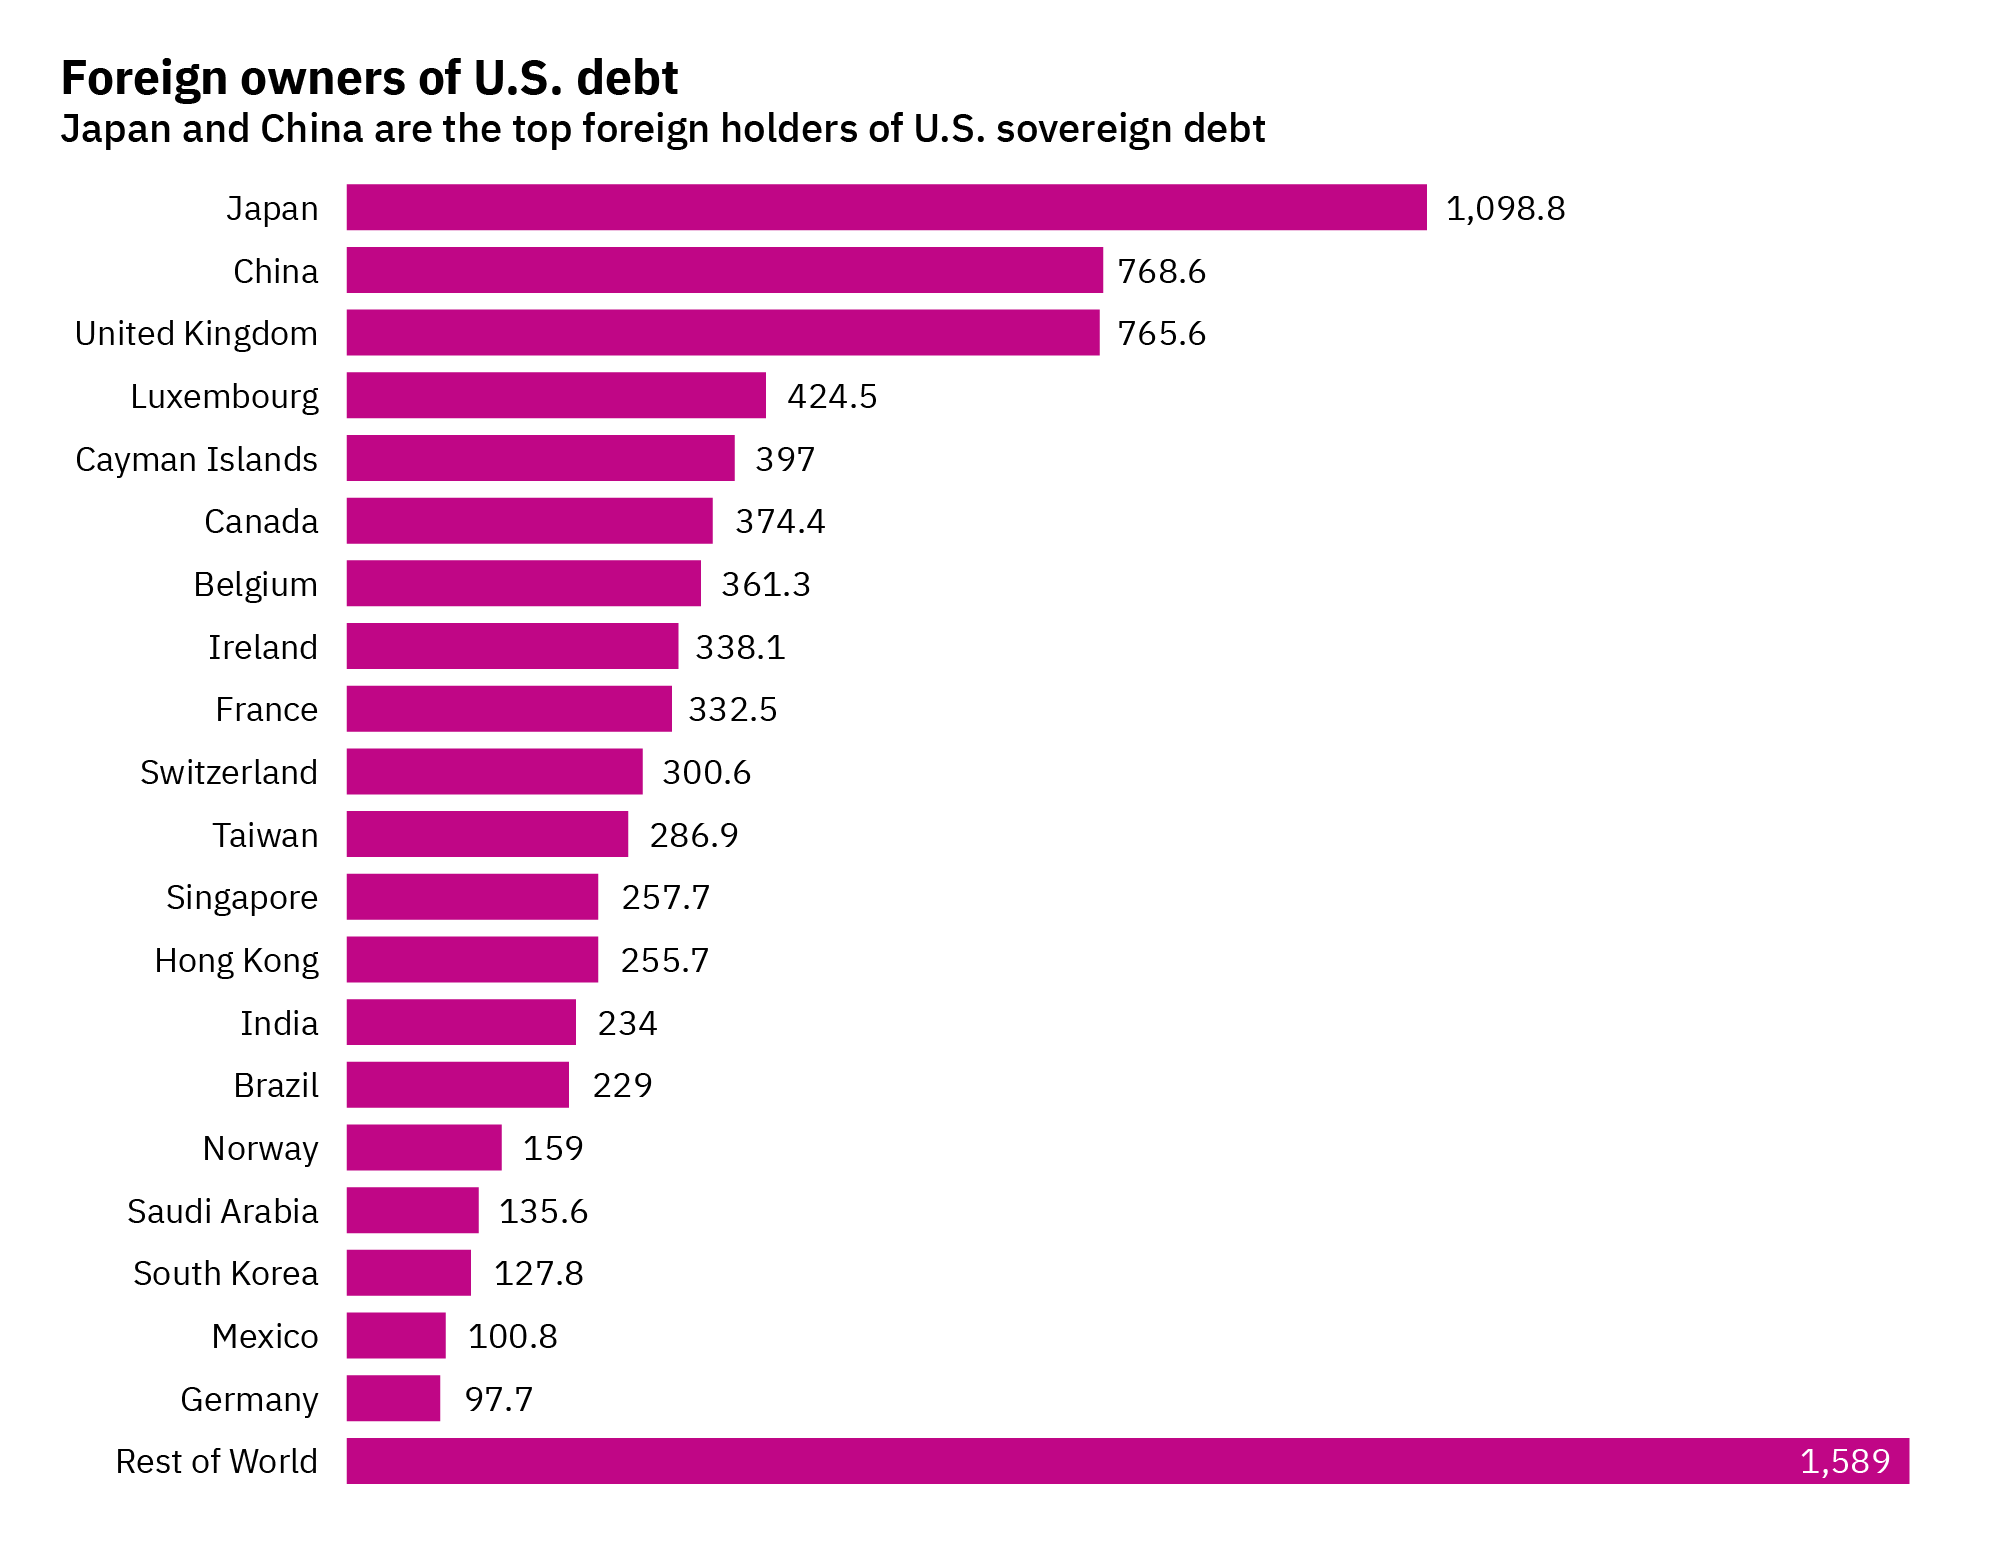
The majority of U.S. government debt, over 55%, is held by U.S.-based, non-government investors. Another 20% is held by the U.S. government, primarily by the Federal Reserve and the U.S. Social Security Administration. Slightly under a quarter of U.S. government debt is held by investors in foreign countries. As the below chart from Reuters shows, Japan ranks first among countries when it comes to holders of U.S. government debt, followed by China and the U.K. to round out the top three.
Our takeaways
- The U.S. Treasury and U.S. dollar are likely to remain the world’s leading safe-haven assets. The U.S. economy remains the world’s largest and most dynamic and the downgrade of U.S. government debt by ratings agencies says more about our political unwillingness to pay our debts than it does our financial ability to do so. The U.S. government is highly solvent – it’s the largest landowner in the county and can raise revenues through taxation and other means, such as selling oil and gas leases on federal land.
That said, I believe we should expect interest rates to climb over time if the debt outlook continues to deteriorate. As interest rates rise, bond prices fall. The longer the maturity, the potential of a bigger fall. This is one reason of many why our bond portfolios generally favor relatively shorter maturities.
- Remain broadly diversified. This year’s extreme market volatility reminds us of the wisdom of broad, global diversification. International stocks have provided a powerful ballast to diversified portfolios, offsetting steep declines in U.S. stocks earlier this year. We must remind ourselves that we diversify to protect portfolios against the unexpected. Since the first downgrade of U.S. government debt in 2011, there have been many ups and downs in U.S. politics and the overall fiscal health of the Republic; we simply don’t know when or how, these battles will play. The best course of action, therefore, is to remain well diversified to protect balance sheets from the unexpected.
- Meet with your advisor. It’s why we’re here. Goals, risk tolerances, liquidity needs, our health – they are ever changing. Work closely with your advisor on your financial plan. Regardless of how we may feel individually about taxes, we should be mindful in our planning that there is a high probability that, at some point and for some period in the future, tax rates could be materially higher than they are today. Rather than ignore this possibility, we believe planning for it is the prudent thing to do.
Click here for past insights about the recent market volatility and other interesting topics. Not a Mercer Advisors client but interested in more information? Let’s talk.
Mercer Advisors Inc. is a parent company of Mercer Global Advisors Inc. and is not involved with investment services. Mercer Global Advisors Inc. (“Mercer Advisors”) is registered as an investment advisor with the SEC. The firm only transacts business in states where it is properly registered or is excluded or exempted from registration requirements.
All expressions of opinion reflect the judgment of the author as of the date of publication and are subject to change. Some of the research and ratings shown in this presentation come from third parties that are not affiliated with Mercer Advisors. The information is believed to be accurate but is not guaranteed or warranted by Mercer Advisors. Content, research, tools and stock or option symbols are for educational and illustrative purposes only and do not imply a recommendation or solicitation to buy or sell a particular security or to engage in any particular investment strategy. For financial planning advice specific to your circumstances, talk to a qualified professional at Mercer Advisors.
Past performance may not be indicative of future results. Therefore, no current or prospective client should assume that the future performance of any specific investment, investment strategy or product made reference to directly or indirectly, will be profitable or equal to past performance levels. All investment strategies have the potential for profit or loss. Changes in investment strategies, contributions or withdrawals may materially alter the performance and results of your portfolio. Different types of investments involve varying degrees of risk, and there can be no assurance that any specific investment will either be suitable or profitable for a client’s investment portfolio. Diversification does not ensure a profit or guarantee against loss. Historical performance results for investment indexes and/or categories, generally do not reflect the deduction of transaction and/or custodial charges or the deduction of an investment-management fee, the incurrence of which would have the effect of decreasing historical performance results. Economic factors, market conditions, and investment strategies will affect the performance of any portfolio and there are no assurances that it will match or outperform any particular benchmark.
This document may contain forward-looking statements including statements regarding our intent, belief or current expectations with respect to market conditions. Readers are cautioned not to place undue reliance on these forward-looking statements. While due care has been used in the preparation of forecast information, actual results may vary in a materially positive or negative manner. Forecasts and hypothetical examples are subject to uncertainty and contingencies outside Mercer Advisors’ control.


Home » Insights » Market Commentary » The Downgrade of U.S. Government Debt: Insights From Our CIO
The Downgrade of U.S. Government Debt: Insights From Our CIO
Donald Calcagni, MBA, MST, CFP®, AIF®
Chief Investment Officer
Moody’s downgrade of U.S. debt raises questions about credit ratings, deficits, and what it means for investors.
In early May, the ratings agency Moody’s downgraded the credit rating of the U.S., pointing to the government’s growing debt burden in a higher-interest rate environment and the lack of political progress towards lowering deficits.
Below we explore some of the more common questions around U.S. government debt and try to put this downgrade in context.
What do these ratings mean?
The U.S. has three major credit rating agencies: S&P, Fitch and Moody’s. These agencies provide evaluate the creditworthiness of major corporate and government borrowers. This rating is used by investors to assess the relative credit risks inherent in the debt (bonds) that they issue to investors.
Bonds are given a rating ranging from AAA to “junk.” AAA, which is a high rating indicating strong creditworthiness and a low risk of default. . Although all three agencies use AAA to indicate the best bonds, they use a different ratings scale to denote declines in the credit worthiness of borrowers. Moody’s just downgraded the U.S. to its second-best credit rating of Aa1. There are 10 different credit ratings that are considered “investment grade”, and the U.S. still has the second-best rating of those 10.
How does the U.S. compare?
Although the U.S. still has a relatively good rating, it’s no longer best-in-class, which may be somewhat surprising for the country with the world’s largest economy. Several other countries still have top credit ratings, including Australia, Germany, Singapore, Sweden, and Switzerland. Just two companies, Microsoft and Johnson & Johnson, also have the top credit rating of AAA.
Per the chart below, only three advanced economies, Japan, Greece, and Italy, have a higher debt burden than the U.S. when expressed as a share of their economy (the debt-to-GDP ratio).
Source: Organisation for Economic Co-operation and Development (OECD). General government debt is the gross debt of the general government as a percentage of GDP.
Hasn’t this downgrade happened before?
Yes, the downgrade has happened before…but not from Moody’s. The U.S. was downgraded by Standard & Poor’s in August 2011, during a showdown between Congress and the White House over the debt ceiling.
In 2023, the ratings agency Fitch followed suit, citing “a high and growing general government debt burden, and the erosion of governance” by which Fitch meant a political environment in which Congress and the White House were having repeated political standoffs that frequently included threats to default on U.S. Treasury obligations.
In announcing its downgrade of U.S. government debt this past week, Moody’s joins the other two agencies in their assessment. The stock market had little reaction to the downgrade since, when it comes to evaluating the stability of U.S. debt, the market arguably already knows everything about the U.S. creditworthiness that Moody’s factored into its analysis. Markets are typically much quicker than ratings agencies when it comes to assessing and pricing risks.
How dire is the U.S. debt outlook?
The federal government has not generated a surplus since 1998-2001. For nearly a quarter century U.S. federal government debt has accumulated year-after-year, regardless of who occupied the White House or which party-controlled Congress.
We frequently remind investors that politics and investing don’t mix, and the growth in U.S. government debt and deficits is yet another example of why. While we may like to think that our preferred political party can easily resolve these issues if they fully controlled Congress and the White House, the fact remains that deficit reduction has remained elusive for both parties across many decades.
Currently, deficits and debt are both large and projected to grow. Now, Congress is considering an extension of the TCJA tax cuts which were implemented in 2018. The Congressional Budget Office projects that an extension of these cuts – which means a reduction in government revenues – would contribute to further increases in annual deficits and in the total amount of government debt outstanding (see charts below).
Source: Congressional Budget Office, J.P. Morgan Asset Management, BEA, Treasury Department. Estimates are from the Congressional Budget Office (CBO) January 2025 An Update to the Budget Outlook: 2025 to 2035.
The deficit for fiscal year 2025 is projected to be larger than all non-defense discretionary spending from the federal government (see below). This is among the reasons why many budget analysts have long argued that closing the deficit will certainly require a painful combination of both higher taxes and lower spending (which invariably will likely require some combination of cuts to entitlements and defense spending, both of which are highly cherished programs).
Source: Congressional Budget Office, J.P. Morgan Asset Management; Numbers may not sum to 100% due to rounding.
Exacerbating our nation’s debt burden is the growing interest expense on outstanding obligations. The U.S. government’s debt outstanding, about $36 trillion is the sum total of all prior deficits incurred by the U.S. government. The interest expense on this debt has grown significantly the past few years as interest rates increased. As older Treasury debt matures (bonds that were issued when interest rates were lower) the U.S. treasury is forced to refinance that debt at today’s interest rates. From 2008 until 2022, the U.S. government benefited from an exceptionally low interest rate environment. Those days are gone.
Who owns our debt?
To understand the scale of our national debt, consider these numbers. The total U.S. debt is about $36 trillion. U.S. gross domestic product is about $30 trillion per year. U.S. households have approximately $169 trillion in total net worth.
The majority of U.S. government debt, over 55%, is held by U.S.-based, non-government investors. Another 20% is held by the U.S. government, primarily by the Federal Reserve and the U.S. Social Security Administration. Slightly under a quarter of U.S. government debt is held by investors in foreign countries. As the below chart from Reuters shows, Japan ranks first among countries when it comes to holders of U.S. government debt, followed by China and the U.K. to round out the top three.
Our takeaways
That said, I believe we should expect interest rates to climb over time if the debt outlook continues to deteriorate. As interest rates rise, bond prices fall. The longer the maturity, the potential of a bigger fall. This is one reason of many why our bond portfolios generally favor relatively shorter maturities.
Click here for past insights about the recent market volatility and other interesting topics. Not a Mercer Advisors client but interested in more information? Let’s talk.
Mercer Advisors Inc. is a parent company of Mercer Global Advisors Inc. and is not involved with investment services. Mercer Global Advisors Inc. (“Mercer Advisors”) is registered as an investment advisor with the SEC. The firm only transacts business in states where it is properly registered or is excluded or exempted from registration requirements.
All expressions of opinion reflect the judgment of the author as of the date of publication and are subject to change. Some of the research and ratings shown in this presentation come from third parties that are not affiliated with Mercer Advisors. The information is believed to be accurate but is not guaranteed or warranted by Mercer Advisors. Content, research, tools and stock or option symbols are for educational and illustrative purposes only and do not imply a recommendation or solicitation to buy or sell a particular security or to engage in any particular investment strategy. For financial planning advice specific to your circumstances, talk to a qualified professional at Mercer Advisors.
Past performance may not be indicative of future results. Therefore, no current or prospective client should assume that the future performance of any specific investment, investment strategy or product made reference to directly or indirectly, will be profitable or equal to past performance levels. All investment strategies have the potential for profit or loss. Changes in investment strategies, contributions or withdrawals may materially alter the performance and results of your portfolio. Different types of investments involve varying degrees of risk, and there can be no assurance that any specific investment will either be suitable or profitable for a client’s investment portfolio. Diversification does not ensure a profit or guarantee against loss. Historical performance results for investment indexes and/or categories, generally do not reflect the deduction of transaction and/or custodial charges or the deduction of an investment-management fee, the incurrence of which would have the effect of decreasing historical performance results. Economic factors, market conditions, and investment strategies will affect the performance of any portfolio and there are no assurances that it will match or outperform any particular benchmark.
This document may contain forward-looking statements including statements regarding our intent, belief or current expectations with respect to market conditions. Readers are cautioned not to place undue reliance on these forward-looking statements. While due care has been used in the preparation of forecast information, actual results may vary in a materially positive or negative manner. Forecasts and hypothetical examples are subject to uncertainty and contingencies outside Mercer Advisors’ control.
Explore More
The Economic and Market Impact of the Iran War After One Month: Insights From Our CIO
Using Retirement Trusts to Protect and Transfer IRAs
Personal Umbrella Insurance: FAQs to Help Protect Your Wealth