Many investors are asking questions about current market valuations, which by any objective measure are currently very high, and whether a change in investment approach is warranted. We wanted to share our thinking about the current situation in U.S. equities and respond to some common questions that we have received.
- Market valuations are high. The forward price/earnings ratio of the S&P 500 is at 22.7 times forward earnings. In other words, stocks are at very high levels compared to the actual earnings of companies. The current ratio is near an all-time high for the index. Every conventional measure of valuation is above its long-term (30-year) average.
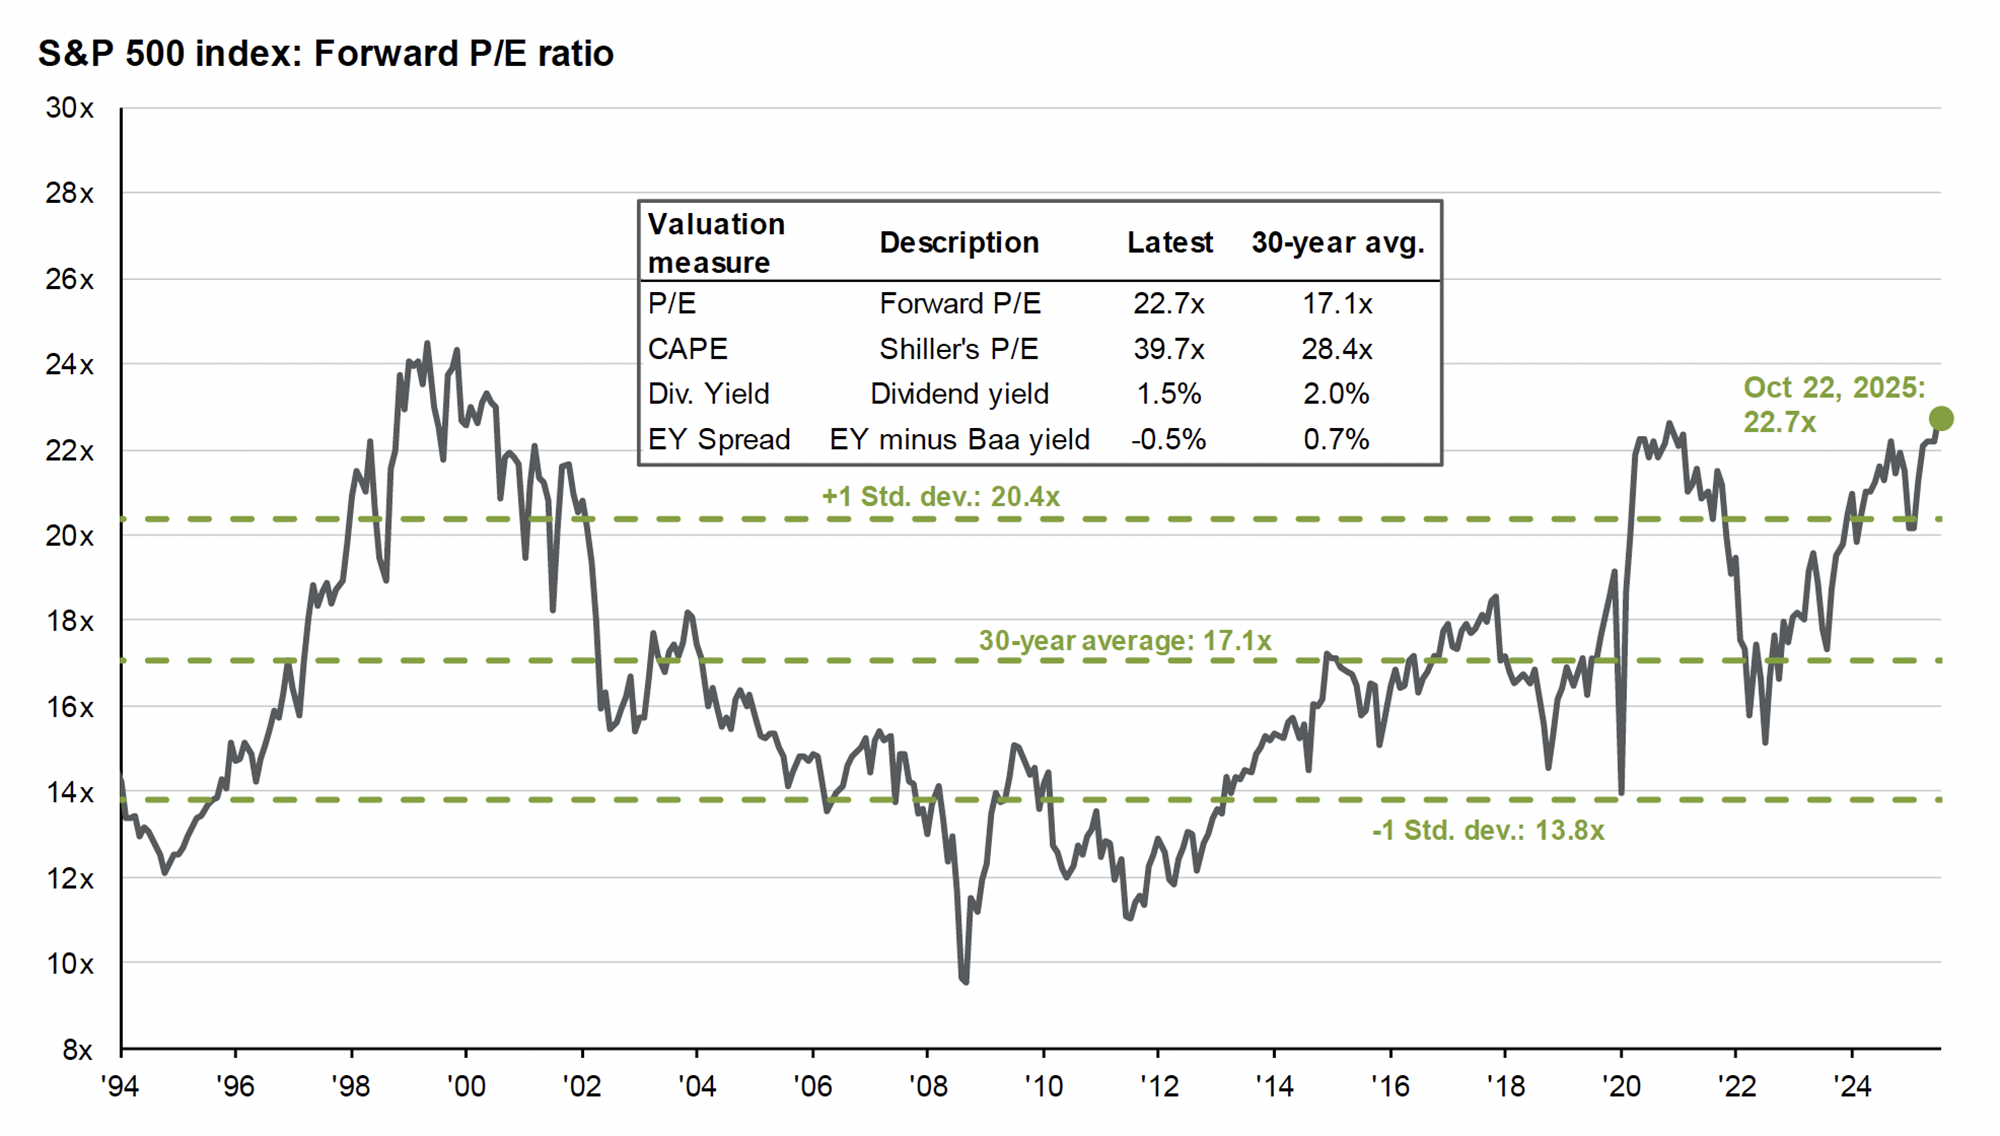
Source: JPMorgan Guide to the Markets. Forward P/E ratio is the most recent S&P 500 index price divided by consensus analyst estimates for earnings in the next 12 months, provided by IBES since March 1994 and FactSet since January 2022. Shiller’s P/E uses trailing 10-years of inflation-adjusted earnings as reported by companies. Dividend yield is calculated as consensus estimates of dividends in the next 12 months, provided by FactSet, divided by the most recent S&P 500 index price. EY minus Baa yield is the forward earnings yield (the inverse of the forward P/E ratio) minus the Bloomberg U.S. corporate Baa yield since December 2008 and interpolated using the Moody’s Baa seasoned corporate bond yield for values beforehand.
- We should remember that market valuations are averages. Not all stocks in the S&P 500 trade at 22.7x forward earnings. The high valuations are especially concentrated within the largest companies. The top 10 stocks by market capitalization have a current forward P/E of 29.6x while the remaining 490 companies trade at 19.6x. Value stocks are cheaper still, currently trading at about 17.2x earnings. Growth stocks currently trade at about 31x.
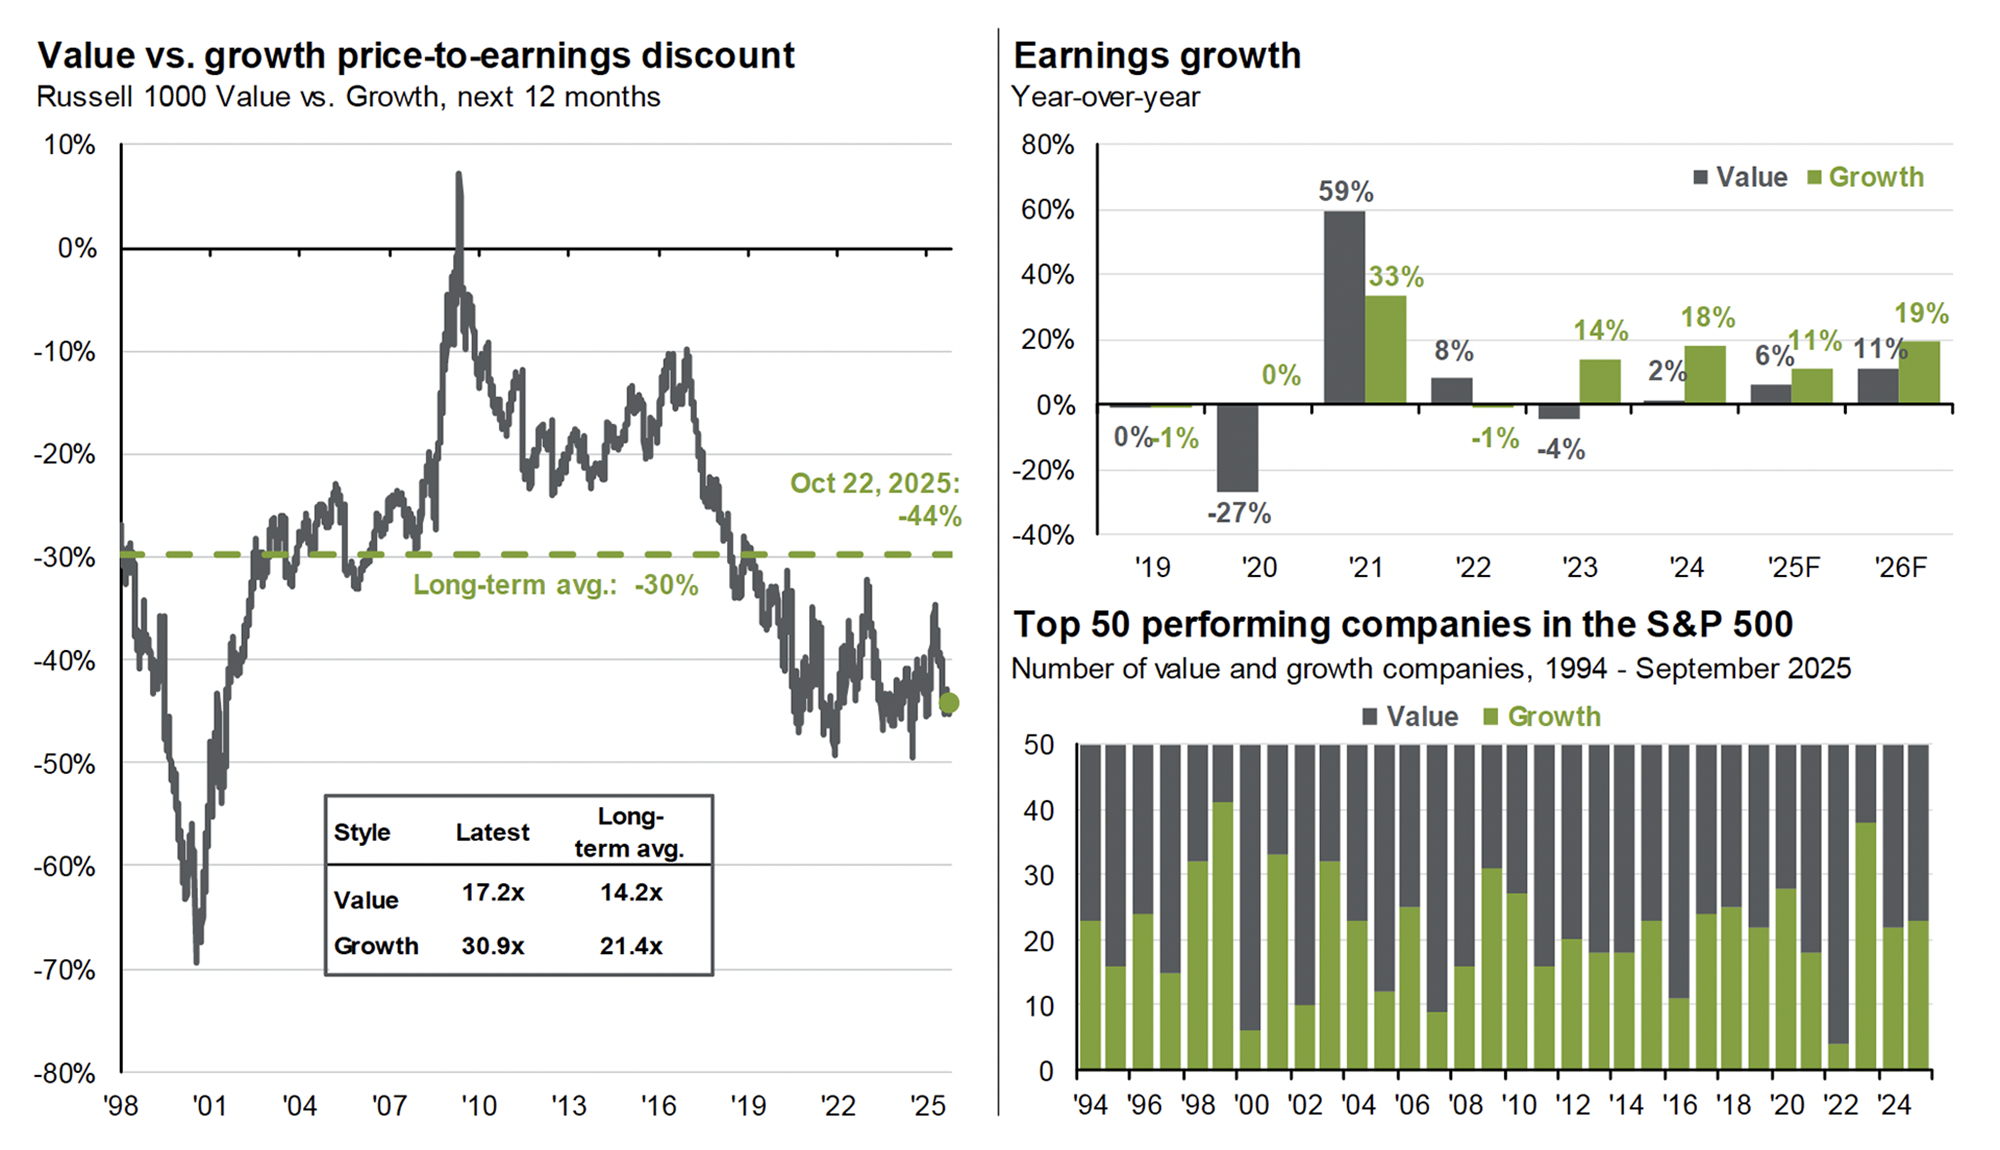
Source: JPMorgan Guide to the Markets. Growth is represented by the Russell 1000 Growth Index and value is represented by the Russell 1000 Value Index. (Left) Long-term averages are calculated monthly since December 1997. (Top right) Earnings estimates for 2025 and 2026 reflect consensus analyst expectations, provided by FactSet. (Bottom right) Graph was made by ranking the S&P 500 constituents by total return each calendar year. On average, 29 of the top 50 performing companies are value and 21 are growth. Past performance is no guarantee of future results.
- “How is today’s market different from the dot-com bubble of the late 1990s?” It’s common for investors to draw parallels between today’s A.I.-driven bull market and the tech boom of the late 1990s. I think the biggest difference is that today’s technology companies are profitable whereas many of the dot-com companies of the late 1990s were not. Nvidia, for example, recently reported revenues of $165 billion (over the past 12 months) and EBITDA (a measure of earnings) of $98.6 billion. The consensus forecast is that Nvidia will grow its earnings per share by a staggering 51% in 2026 and by another 44% in 2027. Today’s high valuations are predicated on the expectation (all things equal) that these companies will deliver higher earnings at some point in the future.
- International equity valuations are lower than their U.S. counterparts. Despite blockbuster year-to-date returns in non-U.S. equities, international stock valuations remain modest compared to the U.S. European stocks trading at 14.9x earnings, or to emerging markets which trade at 14.1x. China’s stock market, despite the country’s ongoing trade war with the U.S., is up 37.5% and trades at a modest 13.3x forward earnings.
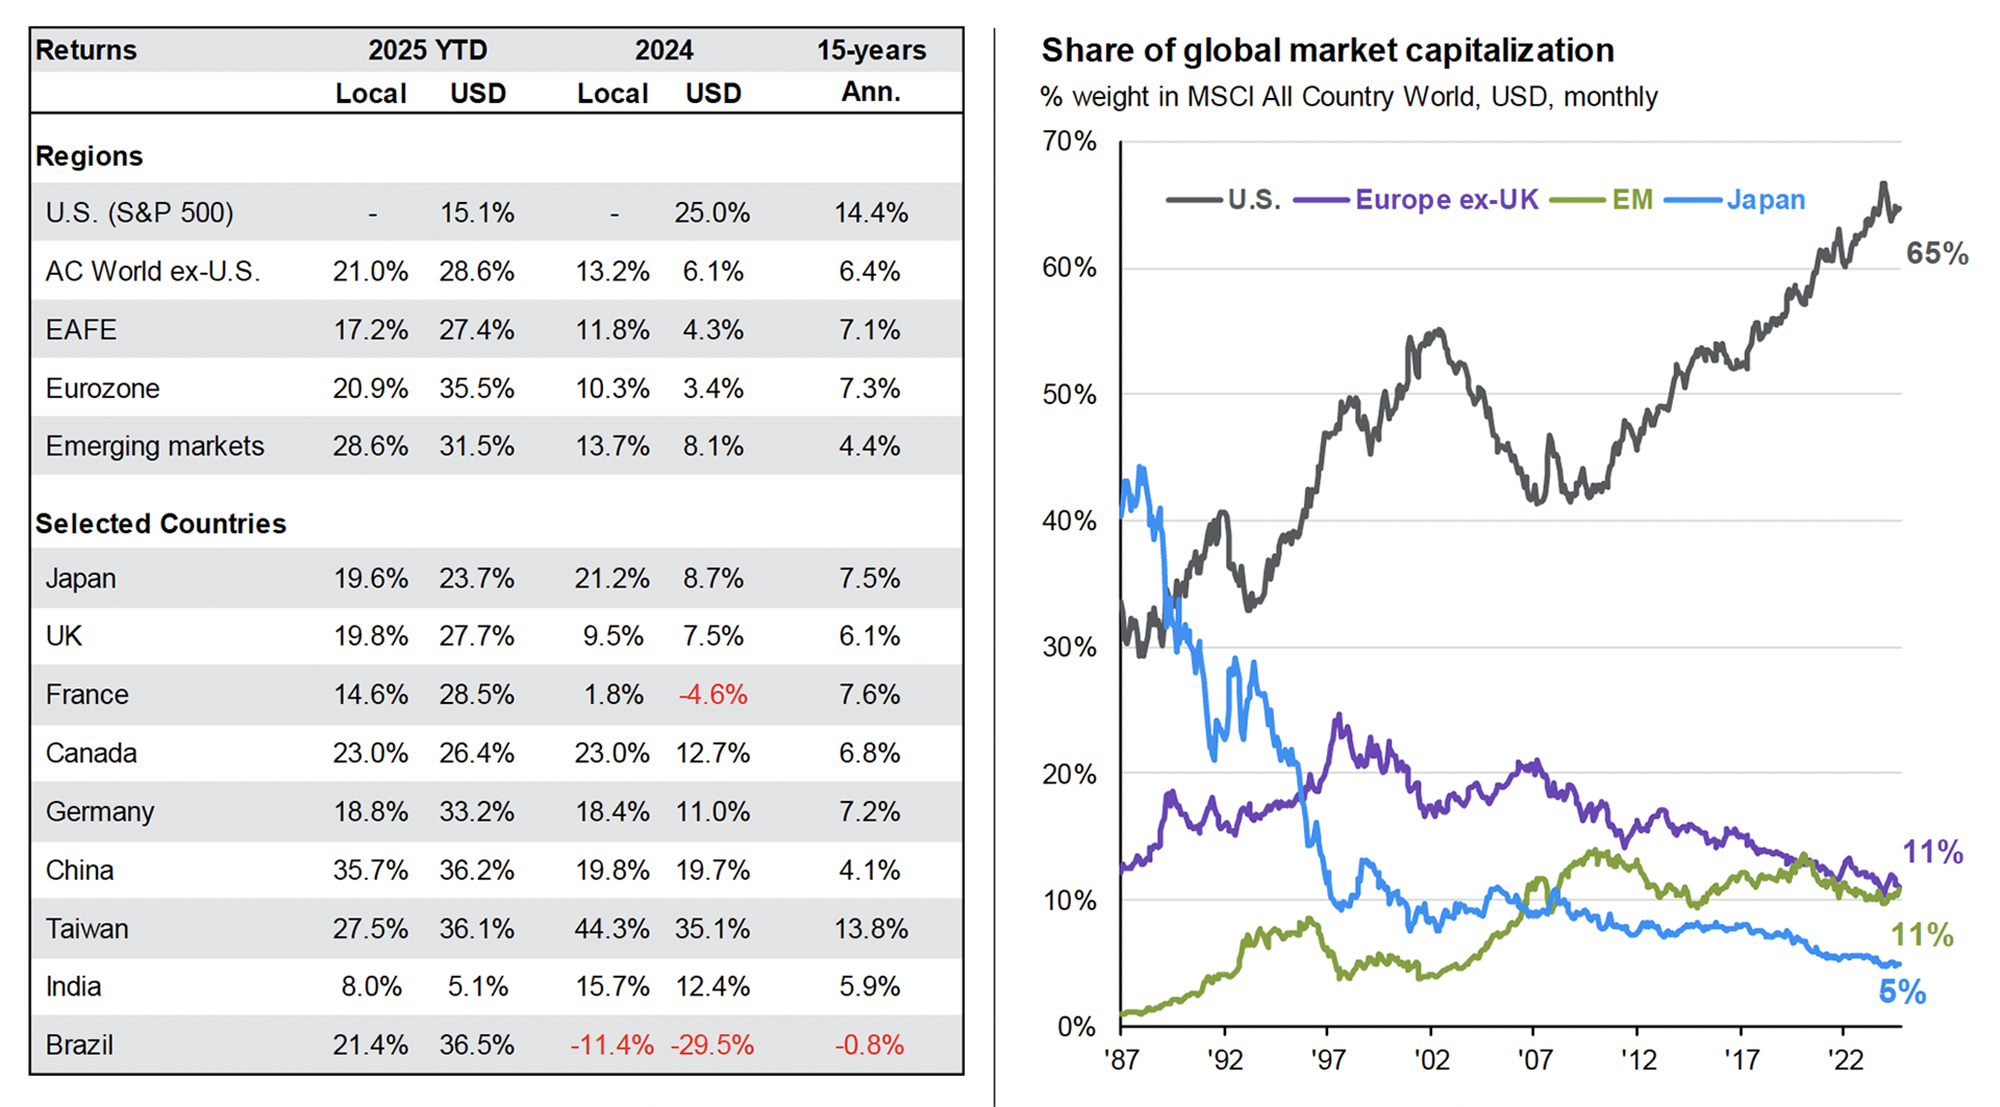
Source: JPMorgan Guide to the Markets. (Left) All return values are MSCI Total Return Index (Gross) data. 15-year history based on USD returns. 15-year annualized return figures are calculated using a rolling 12-month period ending with the previous month-end. Past performance is not a reliable indicator of current and future results.
- “Given valuations, should I sell now, sit in cash, and wait to buy the dip?” No, you shouldn’t. That dip may never come; or it may come many, many years from now. We just don’t know. Valuations could come down overtime through earnings growth — and not a decline in prices. I can’t tell you how many investors I’ve met over the years who sold in March 2009 or late March 2020 and are still “waiting for a good time to get back in.” Timing markets is always challenging, which is why we don’t recommend it. The costs are real. Cash drag (opportunity cost of sitting in cash), inflation, and capital gains taxes are very real costs. Staying invested is the best approach for minimizing those.
- However, for investors sitting on concentrated, undiversified positions, selling with the aim of diversifying their portfolios is the right move (all things equal). We recommend diversification because we know from history that it’s rarely the case that today’s big winners go on to become tomorrow’s. Market leadership changes and companies come and go. Once you have decided to diversify, the strategy that one uses matters greatly, given the potential impact of capital gains taxes. Strategies to consider include exchange funds, a direct indexing solution, or long-short strategy.
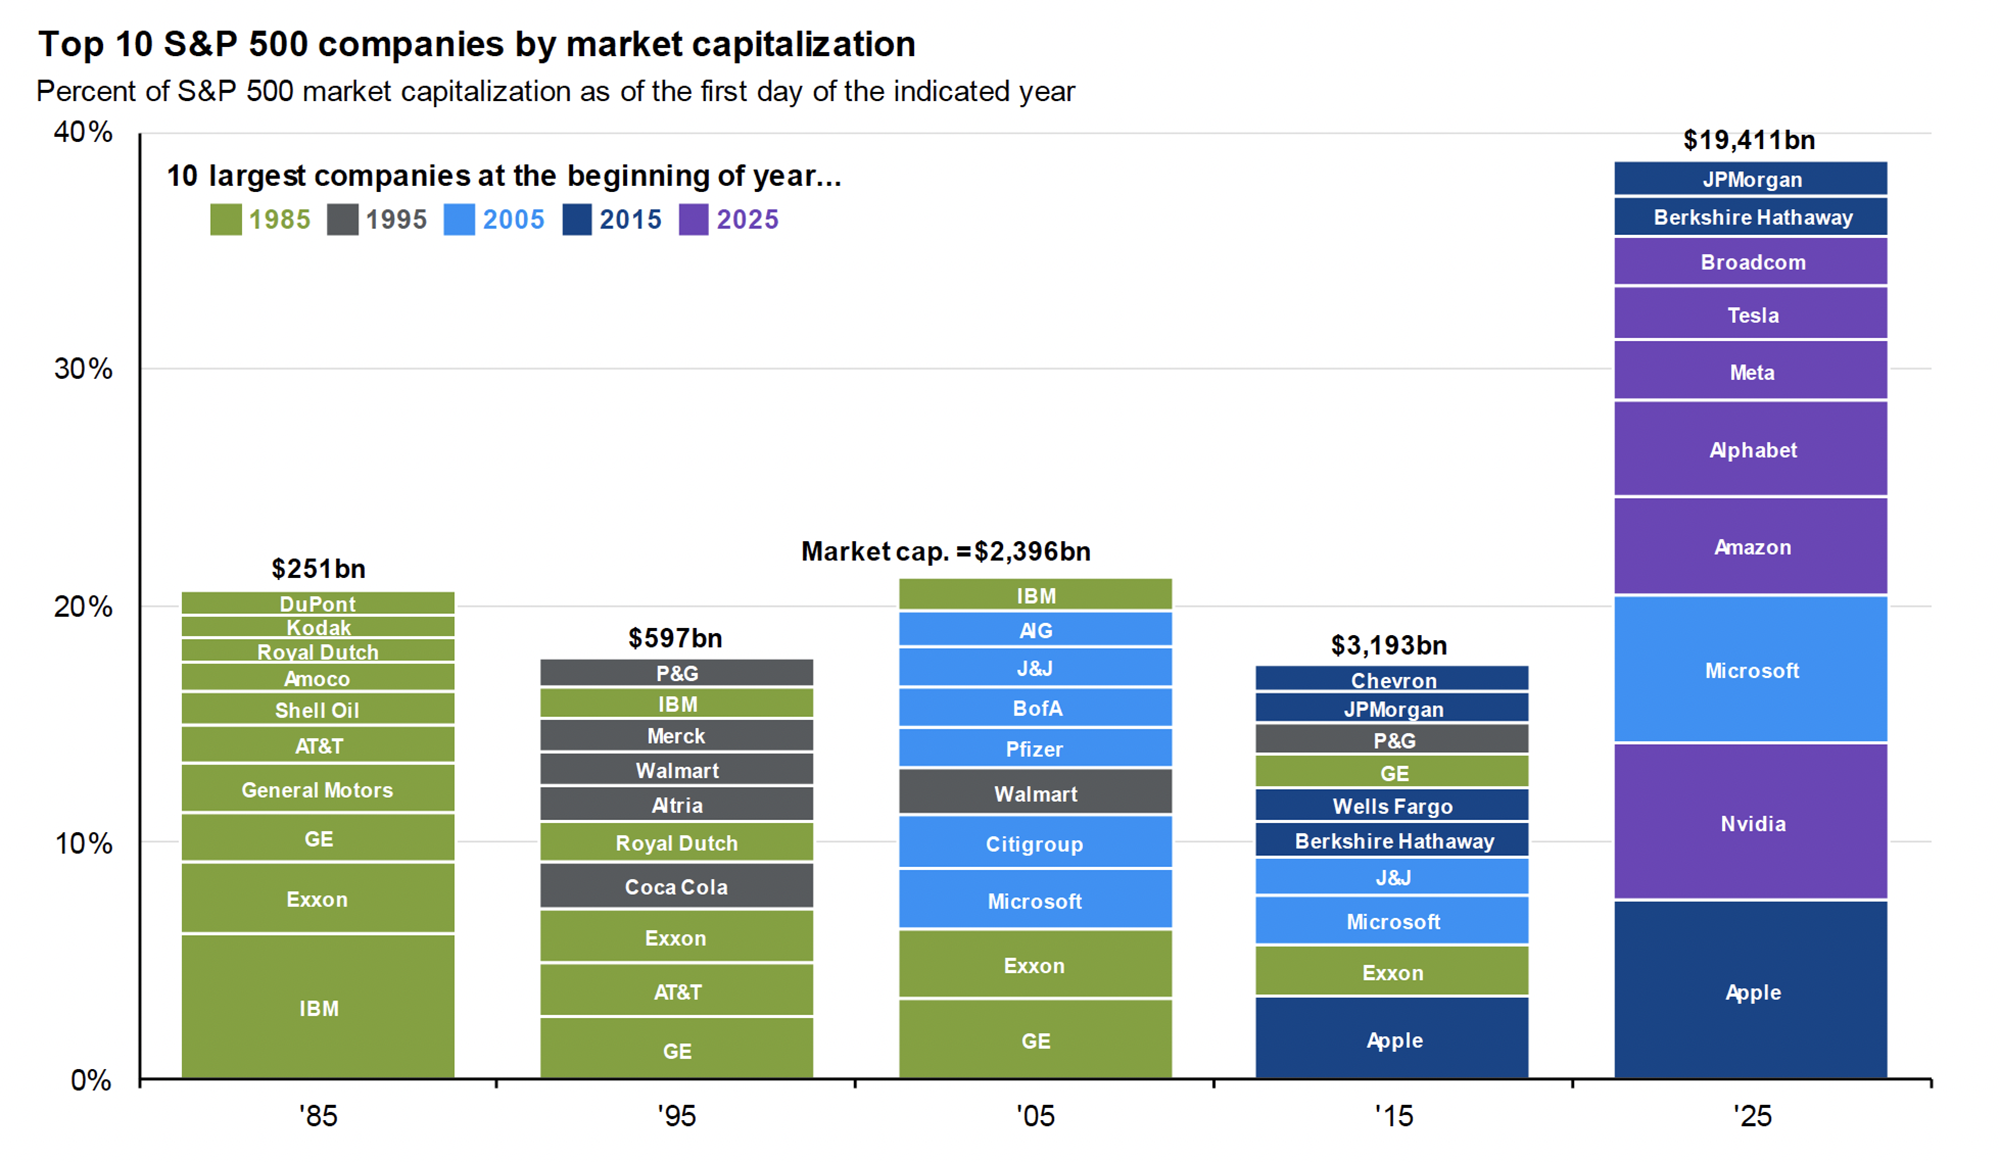
Source: JPMorgan Guide to the Markets. Companies are organized from highest weight at the bottom to lowest weight at the top. Past performance is no guarantee of future results.
- “But with the market at or near all-time highs, isn’t that a sign that markets are ready to fall?” No, not necessarily. It’s true that at higher valuations, expected returns are lower. It’s also true, however, that between January 1926 and December 2024, the 1-year look ahead return for the S&P 500, after hitting an all-time high, is another 13.7%. If this is an unfamiliar concept, consider it like this: If you take all the days that the market closed at what was then a record high, over the next year the market climbed another 13.7%. In hindsight, many of those “all-time highs” were just one step on the way to a much higher peak. It follows that an investor who took their money out of the S&P 500 and held cash instead missed out on 13.7% returns — a steep opportunity cost.
- “But what if the market falls and it doesn’t recover?” Market declines never feel good. But while there are never any guarantees in life, there has never been a permanent impairment of capital for globally diversified, long-term investors. Despite the many severe market corrections of the past 100 years, equity markets have always recovered and over time have gone on to post new highs for the patient investor.
- Shouldn’t my Mercer Advisors portfolio be invested in A.I. stocks? It already is. The great thing about our investment approach is that you don’t need to try to identify tomorrow’s big winners today. If you fell asleep in 1990, when A.I. wasn’t even a thing, did nothing to your portfolio for 35 years, and woke up 10 minutes ago, you would already own A.I. stocks in your portfolio — and you would have owned them by now for many, many years.
Click here for past insights about the recent market volatility and other interesting topics. Not a Mercer Advisors client but interested in more information? Let’s talk.
Mercer Advisors Inc. is a parent company of Mercer Global Advisors Inc. and is not involved with investment services. Mercer Global Advisors Inc. (“Mercer Advisors”) is registered as an investment advisor with the SEC. The firm only transacts business in states where it is properly registered or is excluded or exempted from registration requirements.
All expressions of opinion reflect the judgment of the author as of the date of publication and are subject to change. Some of the research and ratings shown in this presentation come from third parties that are not affiliated with Mercer Advisors. The information is believed to be accurate but is not guaranteed or warranted by Mercer Advisors. Content, research, tools and stock or option symbols are for educational and illustrative purposes only and do not imply a recommendation or solicitation to buy or sell a particular security or to engage in any particular investment strategy. For financial planning advice specific to your circumstances, talk to a qualified professional at Mercer Advisors.
Past performance may not be indicative of future results. Therefore, no current or prospective client should assume that the future performance of any specific investment, investment strategy or product made reference to directly or indirectly, will be profitable or equal to past performance levels. All investment strategies have the potential for profit or loss. Diversification does not ensure a profit or guarantee against loss. Changes in investment strategies, contributions or withdrawals may materially alter the performance and results of your portfolio. Different types of investments involve varying degrees of risk, and there can be no assurance that any specific investment will either be suitable or profitable for a client’s investment portfolio. Historical performance results for investment indexes and/or categories, generally do not reflect the deduction of transaction and/or custodial charges or the deduction of an investment-management fee, the incurrence of which would have the effect of decreasing historical performance results. Indices are not available for direct investment. Economic factors, market conditions, and investment strategies will affect the performance of any portfolio and there are no assurances that it will match or outperform any particular benchmark.
This document may contain forward-looking statements including statements regarding our intent, belief or current expectations with respect to market conditions. Readers are cautioned not to place undue reliance on these forward-looking statements. While due care has been used in the preparation of forecast information, actual results may vary in a materially positive or negative manner. Forecasts and hypothetical examples are subject to uncertainty and contingencies outside Mercer Advisors’ control.
Certified Financial Planner Board of Standards, Inc. (CFP Board) owns the CFP® certification mark, the CERTIFIED FINANCIAL PLANNER™ certification mark, and the CFP® certification mark (with plaque design) logo in the United States, which it authorizes use of by individuals who successfully complete CFP Board’s initial and ongoing certification requirements.


Home » Insights » Market Commentary » Some Perspective on Market Valuations: Insights From Our CIO
Some Perspective on Market Valuations: Insights From Our CIO
Donald Calcagni, MBA, MST, CFP®, AIF®
Chief Investment Officer
CIO Don Calcagni answers investors’ questions about the stock market’s all-time highs and near-record valuations
Many investors are asking questions about current market valuations, which by any objective measure are currently very high, and whether a change in investment approach is warranted. We wanted to share our thinking about the current situation in U.S. equities and respond to some common questions that we have received.
Source: JPMorgan Guide to the Markets. Forward P/E ratio is the most recent S&P 500 index price divided by consensus analyst estimates for earnings in the next 12 months, provided by IBES since March 1994 and FactSet since January 2022. Shiller’s P/E uses trailing 10-years of inflation-adjusted earnings as reported by companies. Dividend yield is calculated as consensus estimates of dividends in the next 12 months, provided by FactSet, divided by the most recent S&P 500 index price. EY minus Baa yield is the forward earnings yield (the inverse of the forward P/E ratio) minus the Bloomberg U.S. corporate Baa yield since December 2008 and interpolated using the Moody’s Baa seasoned corporate bond yield for values beforehand.
Source: JPMorgan Guide to the Markets. Growth is represented by the Russell 1000 Growth Index and value is represented by the Russell 1000 Value Index. (Left) Long-term averages are calculated monthly since December 1997. (Top right) Earnings estimates for 2025 and 2026 reflect consensus analyst expectations, provided by FactSet. (Bottom right) Graph was made by ranking the S&P 500 constituents by total return each calendar year. On average, 29 of the top 50 performing companies are value and 21 are growth. Past performance is no guarantee of future results.
Source: JPMorgan Guide to the Markets. (Left) All return values are MSCI Total Return Index (Gross) data. 15-year history based on USD returns. 15-year annualized return figures are calculated using a rolling 12-month period ending with the previous month-end. Past performance is not a reliable indicator of current and future results.
Source: JPMorgan Guide to the Markets. Companies are organized from highest weight at the bottom to lowest weight at the top. Past performance is no guarantee of future results.
Click here for past insights about the recent market volatility and other interesting topics. Not a Mercer Advisors client but interested in more information? Let’s talk.
Mercer Advisors Inc. is a parent company of Mercer Global Advisors Inc. and is not involved with investment services. Mercer Global Advisors Inc. (“Mercer Advisors”) is registered as an investment advisor with the SEC. The firm only transacts business in states where it is properly registered or is excluded or exempted from registration requirements.
All expressions of opinion reflect the judgment of the author as of the date of publication and are subject to change. Some of the research and ratings shown in this presentation come from third parties that are not affiliated with Mercer Advisors. The information is believed to be accurate but is not guaranteed or warranted by Mercer Advisors. Content, research, tools and stock or option symbols are for educational and illustrative purposes only and do not imply a recommendation or solicitation to buy or sell a particular security or to engage in any particular investment strategy. For financial planning advice specific to your circumstances, talk to a qualified professional at Mercer Advisors.
Past performance may not be indicative of future results. Therefore, no current or prospective client should assume that the future performance of any specific investment, investment strategy or product made reference to directly or indirectly, will be profitable or equal to past performance levels. All investment strategies have the potential for profit or loss. Diversification does not ensure a profit or guarantee against loss. Changes in investment strategies, contributions or withdrawals may materially alter the performance and results of your portfolio. Different types of investments involve varying degrees of risk, and there can be no assurance that any specific investment will either be suitable or profitable for a client’s investment portfolio. Historical performance results for investment indexes and/or categories, generally do not reflect the deduction of transaction and/or custodial charges or the deduction of an investment-management fee, the incurrence of which would have the effect of decreasing historical performance results. Indices are not available for direct investment. Economic factors, market conditions, and investment strategies will affect the performance of any portfolio and there are no assurances that it will match or outperform any particular benchmark.
This document may contain forward-looking statements including statements regarding our intent, belief or current expectations with respect to market conditions. Readers are cautioned not to place undue reliance on these forward-looking statements. While due care has been used in the preparation of forecast information, actual results may vary in a materially positive or negative manner. Forecasts and hypothetical examples are subject to uncertainty and contingencies outside Mercer Advisors’ control.
Certified Financial Planner Board of Standards, Inc. (CFP Board) owns the CFP® certification mark, the CERTIFIED FINANCIAL PLANNER™ certification mark, and the CFP® certification mark (with plaque design) logo in the United States, which it authorizes use of by individuals who successfully complete CFP Board’s initial and ongoing certification requirements.
Explore More
The 7 Most Common Wealth Management Mistakes — and How to Avoid Them
The Case for Calm Amid War and Oil Crisis: Insights From Our CIO
Strategic Giving: How Women Are Redefining Philanthropy