Economic tensions between the U.S. and China have been in the news frequently this year as the countries spar over tariffs. We expect these tensions to likely continue for some time. Given the many questions we’ve received about China’s role in our portfolios, we thought now would be a good time to share our perspective.
What should we know about the situation with China?
Trade policy between the U.S. and China has been in a state of significant flux. The U.S. imposed 10% tariffs on Chinese goods in February and raised them to 20% in March, with China responding with retaliatory tariffs each time. In April, the U.S. raised tariffs against China as high as 145% but then paused the tariffs and lowered them to 30% in May after a period of negotiations.
During this time, additional tariffs to some products and exemptions to others have contributed to an increasingly complex landscape.
Throughout the U.S.-China trade war in President Trump’s first term, there were multiple cycles of escalation and de-escalation, along with many news cycles (which in turn affected the stock market) as trade truce talks gained or lost momentum. It wasn’t until January 2020 that Washington and Beijing reached a deal that stabilized trade terms for the remainder of Trump’s presidency.
A key takeaway is that a period of both significant ups and downs with China, potentially lasting for years, is entirely plausible. While tariffs could eventually lead to a deal and a period of stability, the two countries may just as likely continue to spar or move toward a world where U.S.-China trade is significantly reduced – an outcome that many economists and observers refer to as “decoupling.”
What is at stake?
- The U.S. and China are the world’s two largest economies. In the latest figures from the International Monetary Fund, the U.S. economy’s total output was $29 trillion in 2024 while China’s was $19 trillion.
- The U.S. economy accounts for about 26% of worldwide economic activity; China’s economy accounts for about 17%.
- China is the second-largest source of U.S. imports (after Mexico) with $439 billion in goods imported in 2024.
- The U.S. trade deficit with China is greater than with any other country, meaning the U.S. imports far more from China than it exports to China. Last year, imports exceeded exports by $295 billion.
- China is the second-largest foreign holder of U.S. government debt after Japan. China holds about $770 billion in U.S. Treasuries — about 2% of total U.S. government debt outstanding.
How exposed are our portfolios to China?
Most Mercer Advisors clients have limited exposure to China’s equity market. Our Multifactor ETF 100 portfolio, for example, has 1.68% exposure to China. Our Multifactor ETF 60/40 portfolio, one of the most common portfolios amongst our investors, has a 1.12% exposure to China.
How has China’s equity market performed thus far this year?
Chinese investments have had a strong run this year with stocks up about 13%. The below table provides some context for how that compares to other equity indices.
| MSCI China Gross Total Return USD Index |
13.22% |
| MSCI Emerging Market Gross Total Return USD Index |
8.89% |
| MSCI ACWI ex USA Gross Total Return USD Index |
14.37% |
| S&P 500 |
1.06% |
We have seen throughout 2025 the importance of non-U.S. diversification. With European stocks, as previously noted in other commentary, a significant portion of their outperformance over U.S. equities has been due to a weakening U.S. dollar (as well as rising earnings and expanding multiples). However, the currency effect has not contributed to Chinese equity outperformance this year given a relatively stable exchange rate between the U.S. dollar and Chinese Yuan.
Most of China’s YTD outperformance stems from rising valuations for Chinese stocks. Of the more than 13% increase in Chinese stocks, a bit less than 10% can be attributed to rising valuations, 2.5% can be attributed to increased profitability and about 1% to dividend growth.
Is this too much exposure to China? Too little?
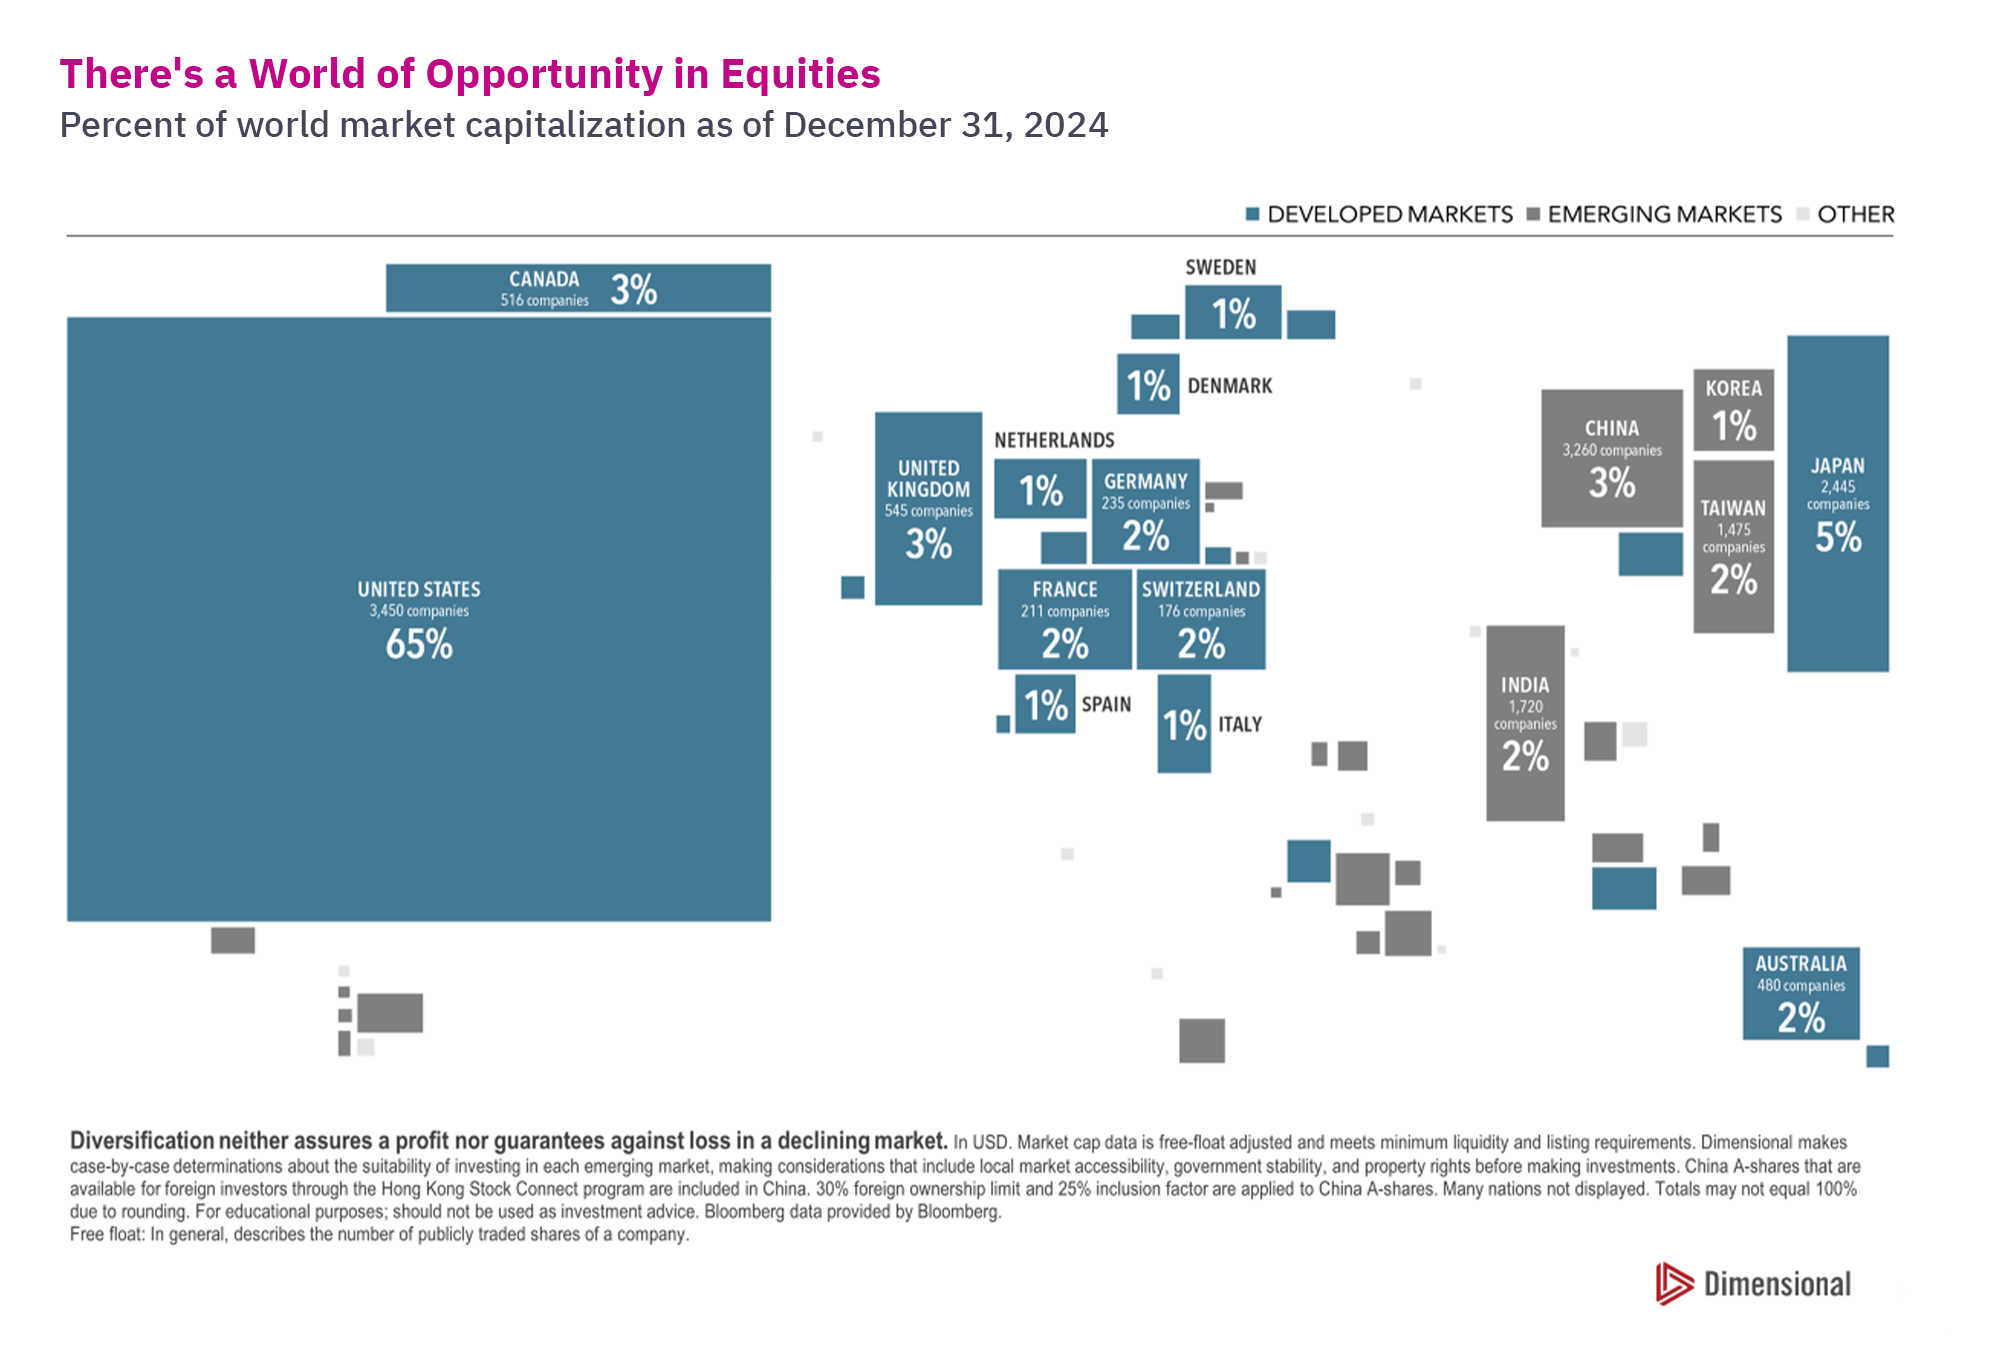
China’s equity market capitalization currently makes up about 3% of total global market capitalization. With a 1.68% allocation to China, this means our portfolios are currently slightly underweight relative to the global market. However, when we consider that approximately 50% of China’s 3,260 companies are Government-Sponsored Entities (“GSEs”, which are effectively controlled by Beijing) and significant capital constraints on foreign investors, we believe an underweight to China remains warranted.
It’s also through a small underweight to non-U.S. markets, both developed and emerging, that we’re able to remain slightly overweight in U.S. companies (which we maintain makes sense for certain reasons — a topic for another day). In addition, we offer our clients the option to exclude direct China equity exposure from their portfolios.
One closing thought on this topic before we move on: There are many ways through which portfolios have exposure to China — not just through direct equity ownership.
Given the sheer size of their economy, investors simply can’t avoid exposure to China. For example, any investor in the S&P 500 inevitably has some exposure to global economic conditions and China in particular. The largest American companies are (with few exceptions) global multinational corporations with operations in China. About 7% of total annual revenue in S&P 500 companies comes from sales that U.S. companies make in China. Torsten Slok, the chief economist of Apollo Global Management, notes that while we often focus on the trade deficit with China, U.S. companies made over $1 trillion in revenue selling products to Chinese consumers. That number is quadruple the size of the deficit.
Takeaways
The evolving U.S.-China economic relationship is likely to remain one of the most important developments to track in global financial markets for years to come. For now, we would emphasize the following key takeaways.
1. Remain broadly diversified as trade uncertainty is likely to continue. It’s possible that relations between the two countries will remain in flux for an extended period. We also believe abrupt shifts between tariff escalations and negotiated de-escalations are likely to continue. We believe that broad diversification, rather than attempting to guess every up and down in this turbulent relationship, remains the best approach.
2. Non-U.S. diversification has proven highly valuable this year. As shown in the table below, non-U.S. equity developed market equity ETFs are up nearly 20% year-to-date. Emerging market ETFs are up around 10% on average. Those returns have significantly helped buoy volatile and anemic returns in U.S. equities (the S&P 500, for context, returned 1.56% year-to-date through Thursday, June 5.)
| Non-U.S. Developed Market ETFs |
| Dimensional International Core Equity 2 ETF (DFIC) |
19.37% |
| Vanguard Developed Markets Index Fund ETF (VEA) |
17.86% |
| Dimensional International High Profitability ETF (DIHP) |
16.75% |
| iShares MSCI Intl Momentum Factor (IMTM) |
21.39% |
| Dimensional International Value ETF (DFIV) |
20.29% |
| |
| Emerging Markets ETFs |
| Avantis Emerging Markets Equity ETF (AVEM) |
12.54% |
| Vanguard FTSE Emerging Markets (VWO) |
9.17% |
Source: Ycharts
3. We will continue to monitor markets and tariff-related developments. The future is ultimately unknowable. We’re very mindful of the fact that relations with China could go in any number of directions. Given the uncertain environment, we believe our approach — one that focuses on broad diversification, both across and within major global asset classes — remains the best approach for investors.
Click here for past insights about the recent market volatility and other interesting topics. Not a Mercer Advisors client but interested in more information? Let’s talk.
Mercer Advisors Inc. is a parent company of Mercer Global Advisors Inc. and is not involved with investment services. Mercer Global Advisors Inc. (“Mercer Advisors”) is registered as an investment advisor with the SEC. The firm only transacts business in states where it is properly registered or is excluded or exempted from registration requirements.
All expressions of opinion reflect the judgment of the author as of the date of publication and are subject to change. Some of the research and ratings shown in this presentation come from third parties that are not affiliated with Mercer Advisors. The information is believed to be accurate but is not guaranteed or warranted by Mercer Advisors. Content, research, tools and stock or option symbols are for educational and illustrative purposes only and do not imply a recommendation or solicitation to buy or sell a particular security or to engage in any particular investment strategy. For financial planning advice specific to your circumstances, talk to a qualified professional at Mercer Advisors.
Past performance may not be indicative of future results. Therefore, no current or prospective client should assume that the future performance of any specific investment, investment strategy or product made reference to directly or indirectly, will be profitable or equal to past performance levels. All investment strategies have the potential for profit or loss. Changes in investment strategies, contributions or withdrawals may materially alter the performance and results of your portfolio. Different types of investments involve varying degrees of risk, and there can be no assurance that any specific investment will either be suitable or profitable for a client’s investment portfolio. Diversification does not ensure a profit or guarantee against loss. Historical performance results for investment indexes and/or categories, generally do not reflect the deduction of transaction and/or custodial charges or the deduction of an investment-management fee, the incurrence of which would have the effect of decreasing historical performance results. Economic factors, market conditions, and investment strategies will affect the performance of any portfolio and there are no assurances that it will match or outperform any particular benchmark.
This document may contain forward-looking statements including statements regarding our intent, belief or current expectations with respect to market conditions. Readers are cautioned not to place undue reliance on these forward-looking statements. While due care has been used in the preparation of forecast information, actual results may vary in a materially positive or negative manner. Forecasts and hypothetical examples are subject to uncertainty and contingencies outside Mercer Advisors’ control.
Certified Financial Planner Board of Standards, Inc. (CFP Board) owns the CFP® certification mark, the CERTIFIED FINANCIAL PLANNER® certification mark, and the CFP® certification mark (with plaque design) logo in the United States, which it authorizes use of by individuals who successfully complete CFP Board’s initial and ongoing certification requirements.


Home » Insights » Market Commentary » Investing Amid the U.S.-China Trade War: Insights From Our CIO
Investing Amid the U.S.-China Trade War: Insights From Our CIO
Donald Calcagni, MBA, MST, CFP®, AIF®
Chief Investment Officer
What investors should know about tariffs, trade, and China’s role in global portfolios.
Economic tensions between the U.S. and China have been in the news frequently this year as the countries spar over tariffs. We expect these tensions to likely continue for some time. Given the many questions we’ve received about China’s role in our portfolios, we thought now would be a good time to share our perspective.
What should we know about the situation with China?
Trade policy between the U.S. and China has been in a state of significant flux. The U.S. imposed 10% tariffs on Chinese goods in February and raised them to 20% in March, with China responding with retaliatory tariffs each time. In April, the U.S. raised tariffs against China as high as 145% but then paused the tariffs and lowered them to 30% in May after a period of negotiations.
During this time, additional tariffs to some products and exemptions to others have contributed to an increasingly complex landscape.
Throughout the U.S.-China trade war in President Trump’s first term, there were multiple cycles of escalation and de-escalation, along with many news cycles (which in turn affected the stock market) as trade truce talks gained or lost momentum. It wasn’t until January 2020 that Washington and Beijing reached a deal that stabilized trade terms for the remainder of Trump’s presidency.
A key takeaway is that a period of both significant ups and downs with China, potentially lasting for years, is entirely plausible. While tariffs could eventually lead to a deal and a period of stability, the two countries may just as likely continue to spar or move toward a world where U.S.-China trade is significantly reduced – an outcome that many economists and observers refer to as “decoupling.”
What is at stake?
How exposed are our portfolios to China?
Most Mercer Advisors clients have limited exposure to China’s equity market. Our Multifactor ETF 100 portfolio, for example, has 1.68% exposure to China. Our Multifactor ETF 60/40 portfolio, one of the most common portfolios amongst our investors, has a 1.12% exposure to China.
How has China’s equity market performed thus far this year?
Chinese investments have had a strong run this year with stocks up about 13%. The below table provides some context for how that compares to other equity indices.
We have seen throughout 2025 the importance of non-U.S. diversification. With European stocks, as previously noted in other commentary, a significant portion of their outperformance over U.S. equities has been due to a weakening U.S. dollar (as well as rising earnings and expanding multiples). However, the currency effect has not contributed to Chinese equity outperformance this year given a relatively stable exchange rate between the U.S. dollar and Chinese Yuan.
Most of China’s YTD outperformance stems from rising valuations for Chinese stocks. Of the more than 13% increase in Chinese stocks, a bit less than 10% can be attributed to rising valuations, 2.5% can be attributed to increased profitability and about 1% to dividend growth.
Is this too much exposure to China? Too little?
China’s equity market capitalization currently makes up about 3% of total global market capitalization. With a 1.68% allocation to China, this means our portfolios are currently slightly underweight relative to the global market. However, when we consider that approximately 50% of China’s 3,260 companies are Government-Sponsored Entities (“GSEs”, which are effectively controlled by Beijing) and significant capital constraints on foreign investors, we believe an underweight to China remains warranted.
It’s also through a small underweight to non-U.S. markets, both developed and emerging, that we’re able to remain slightly overweight in U.S. companies (which we maintain makes sense for certain reasons — a topic for another day). In addition, we offer our clients the option to exclude direct China equity exposure from their portfolios.
One closing thought on this topic before we move on: There are many ways through which portfolios have exposure to China — not just through direct equity ownership.
Given the sheer size of their economy, investors simply can’t avoid exposure to China. For example, any investor in the S&P 500 inevitably has some exposure to global economic conditions and China in particular. The largest American companies are (with few exceptions) global multinational corporations with operations in China. About 7% of total annual revenue in S&P 500 companies comes from sales that U.S. companies make in China. Torsten Slok, the chief economist of Apollo Global Management, notes that while we often focus on the trade deficit with China, U.S. companies made over $1 trillion in revenue selling products to Chinese consumers. That number is quadruple the size of the deficit.
Takeaways
The evolving U.S.-China economic relationship is likely to remain one of the most important developments to track in global financial markets for years to come. For now, we would emphasize the following key takeaways.
1. Remain broadly diversified as trade uncertainty is likely to continue. It’s possible that relations between the two countries will remain in flux for an extended period. We also believe abrupt shifts between tariff escalations and negotiated de-escalations are likely to continue. We believe that broad diversification, rather than attempting to guess every up and down in this turbulent relationship, remains the best approach.
2. Non-U.S. diversification has proven highly valuable this year. As shown in the table below, non-U.S. equity developed market equity ETFs are up nearly 20% year-to-date. Emerging market ETFs are up around 10% on average. Those returns have significantly helped buoy volatile and anemic returns in U.S. equities (the S&P 500, for context, returned 1.56% year-to-date through Thursday, June 5.)
Source: Ycharts
3. We will continue to monitor markets and tariff-related developments. The future is ultimately unknowable. We’re very mindful of the fact that relations with China could go in any number of directions. Given the uncertain environment, we believe our approach — one that focuses on broad diversification, both across and within major global asset classes — remains the best approach for investors.
Click here for past insights about the recent market volatility and other interesting topics. Not a Mercer Advisors client but interested in more information? Let’s talk.
Mercer Advisors Inc. is a parent company of Mercer Global Advisors Inc. and is not involved with investment services. Mercer Global Advisors Inc. (“Mercer Advisors”) is registered as an investment advisor with the SEC. The firm only transacts business in states where it is properly registered or is excluded or exempted from registration requirements.
All expressions of opinion reflect the judgment of the author as of the date of publication and are subject to change. Some of the research and ratings shown in this presentation come from third parties that are not affiliated with Mercer Advisors. The information is believed to be accurate but is not guaranteed or warranted by Mercer Advisors. Content, research, tools and stock or option symbols are for educational and illustrative purposes only and do not imply a recommendation or solicitation to buy or sell a particular security or to engage in any particular investment strategy. For financial planning advice specific to your circumstances, talk to a qualified professional at Mercer Advisors.
Past performance may not be indicative of future results. Therefore, no current or prospective client should assume that the future performance of any specific investment, investment strategy or product made reference to directly or indirectly, will be profitable or equal to past performance levels. All investment strategies have the potential for profit or loss. Changes in investment strategies, contributions or withdrawals may materially alter the performance and results of your portfolio. Different types of investments involve varying degrees of risk, and there can be no assurance that any specific investment will either be suitable or profitable for a client’s investment portfolio. Diversification does not ensure a profit or guarantee against loss. Historical performance results for investment indexes and/or categories, generally do not reflect the deduction of transaction and/or custodial charges or the deduction of an investment-management fee, the incurrence of which would have the effect of decreasing historical performance results. Economic factors, market conditions, and investment strategies will affect the performance of any portfolio and there are no assurances that it will match or outperform any particular benchmark.
This document may contain forward-looking statements including statements regarding our intent, belief or current expectations with respect to market conditions. Readers are cautioned not to place undue reliance on these forward-looking statements. While due care has been used in the preparation of forecast information, actual results may vary in a materially positive or negative manner. Forecasts and hypothetical examples are subject to uncertainty and contingencies outside Mercer Advisors’ control.
Certified Financial Planner Board of Standards, Inc. (CFP Board) owns the CFP® certification mark, the CERTIFIED FINANCIAL PLANNER® certification mark, and the CFP® certification mark (with plaque design) logo in the United States, which it authorizes use of by individuals who successfully complete CFP Board’s initial and ongoing certification requirements.
Explore More
The Economic and Market Impact of the Iran War After One Month: Insights From Our CIO
Using Retirement Trusts to Protect and Transfer IRAs
Personal Umbrella Insurance: FAQs to Help Protect Your Wealth